Uncategorized files
Jump to navigation
Jump to search
Showing below up to 50 results in range #21 to #70.
View (previous 50 | next 50) (20 | 50 | 100 | 250 | 500)
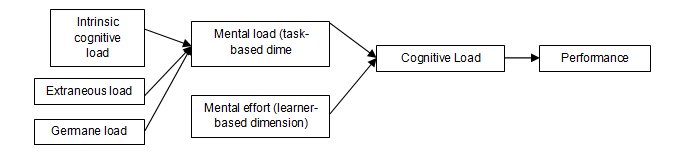 CLT.jpg 673 × 159; 16 KB
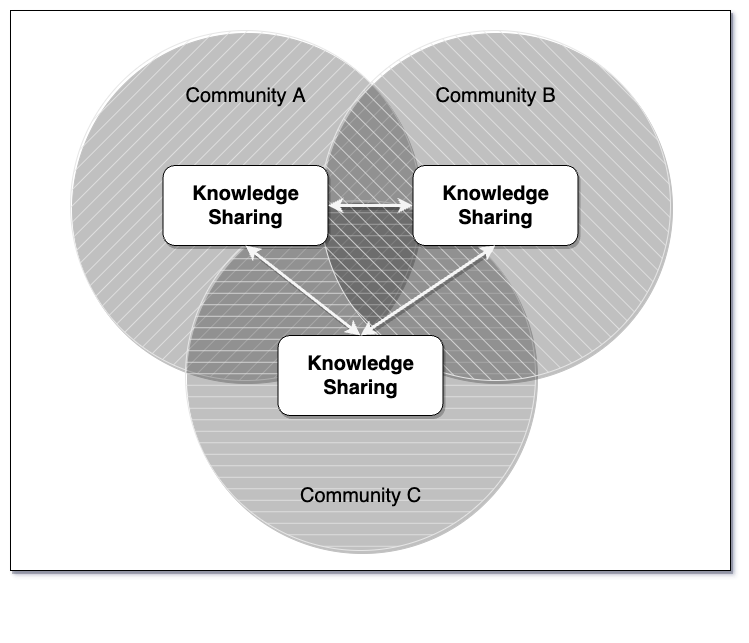 COP.png 749 × 643; 77 KB
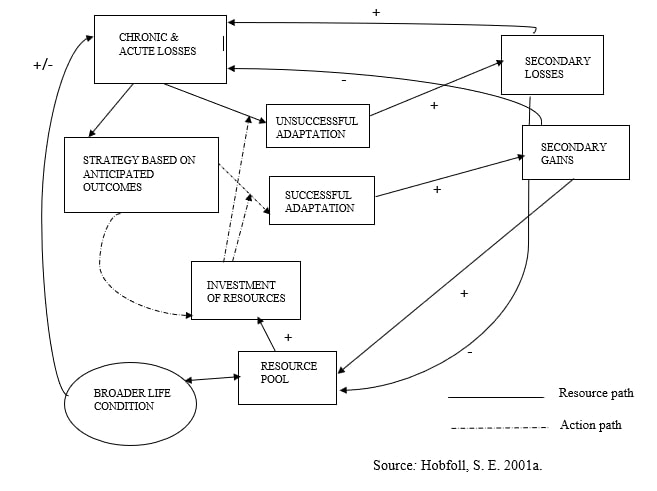 COR.jpg 657 × 491; 34 KB
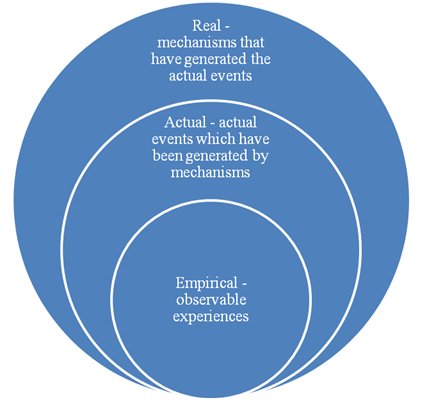 CRT.jpg 429 × 404; 23 KB
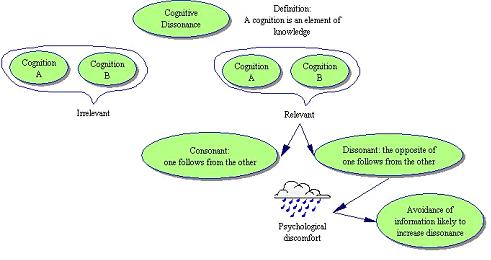 Cdt.JPG 491 × 260; 21 KB
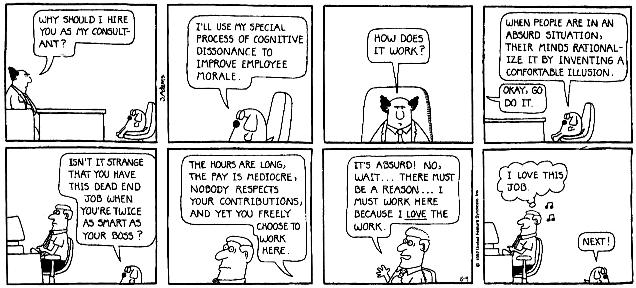 Cdt2.JPG 636 × 288; 56 KB
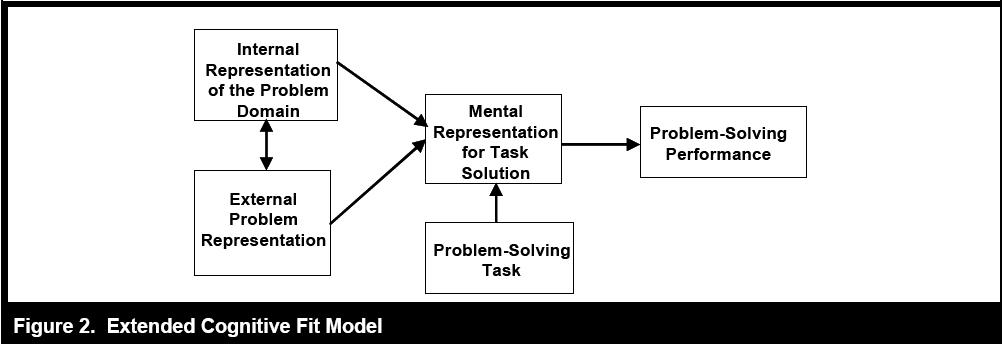 Cfit.JPG 1,002 × 344; 33 KB
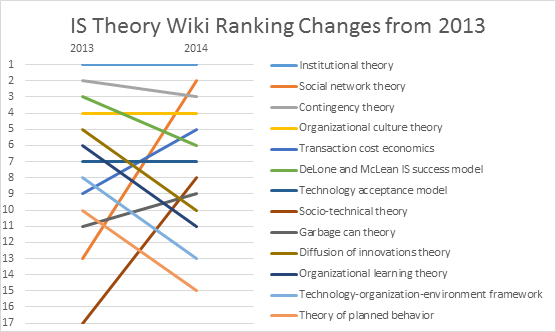 Chart-v1.png 556 × 332; 24 KB
 Coloradouniversity.jpg 576 × 576; 178 KB
 Cont1.JPG 463 × 203; 14 KB
 Cont2.JPG 363 × 291; 11 KB
 Cse.JPG 682 × 551; 43 KB
 Customer Focus Model.jpg 622 × 420; 33 KB
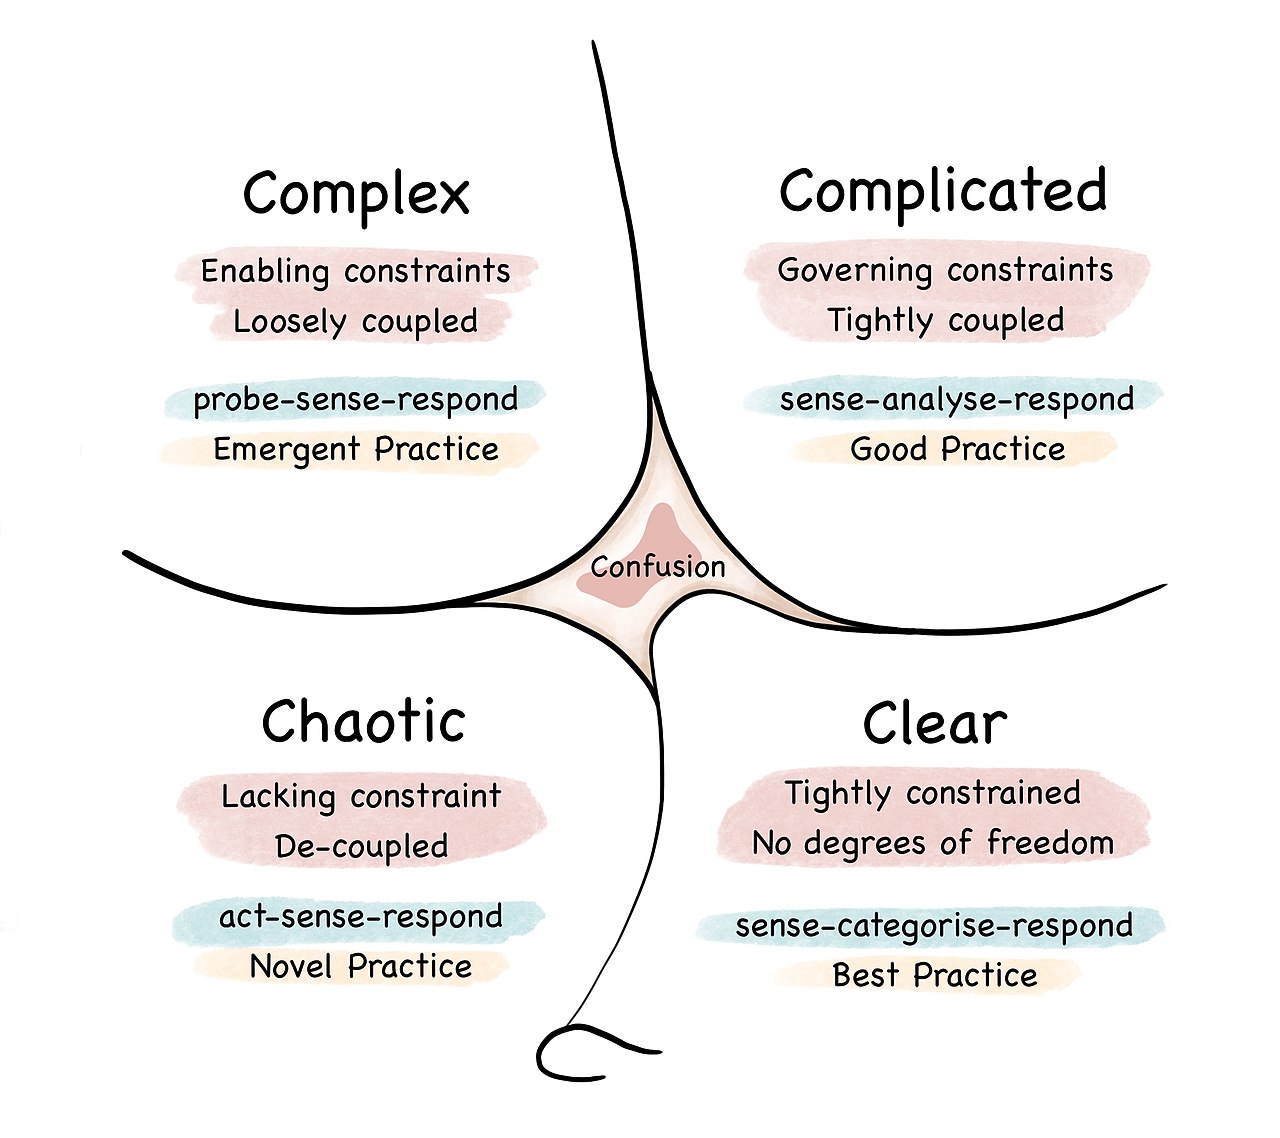 Cynefin framework 2022.jpg 1,280 × 1,138; 152 KB
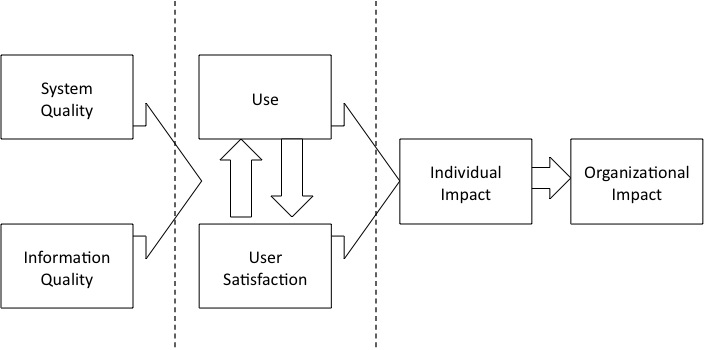 D&M1992.jpg 704 × 350; 35 KB
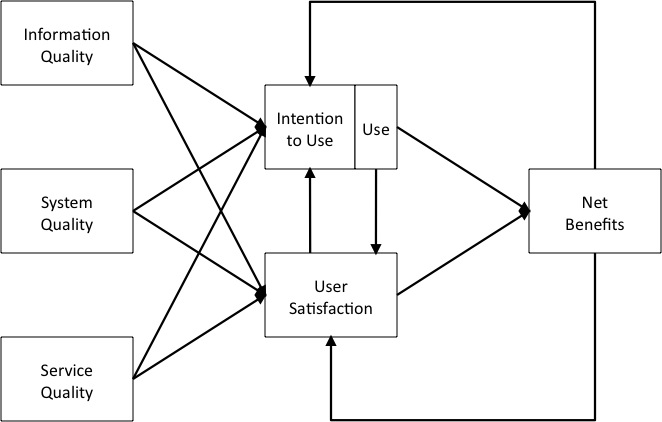 D&M2002.jpg 662 × 422; 40 KB
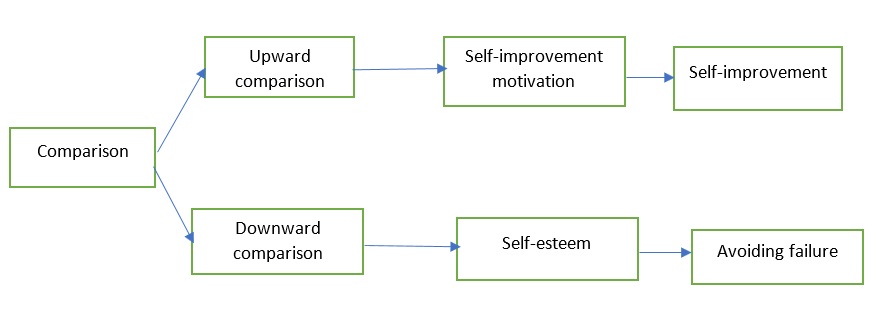
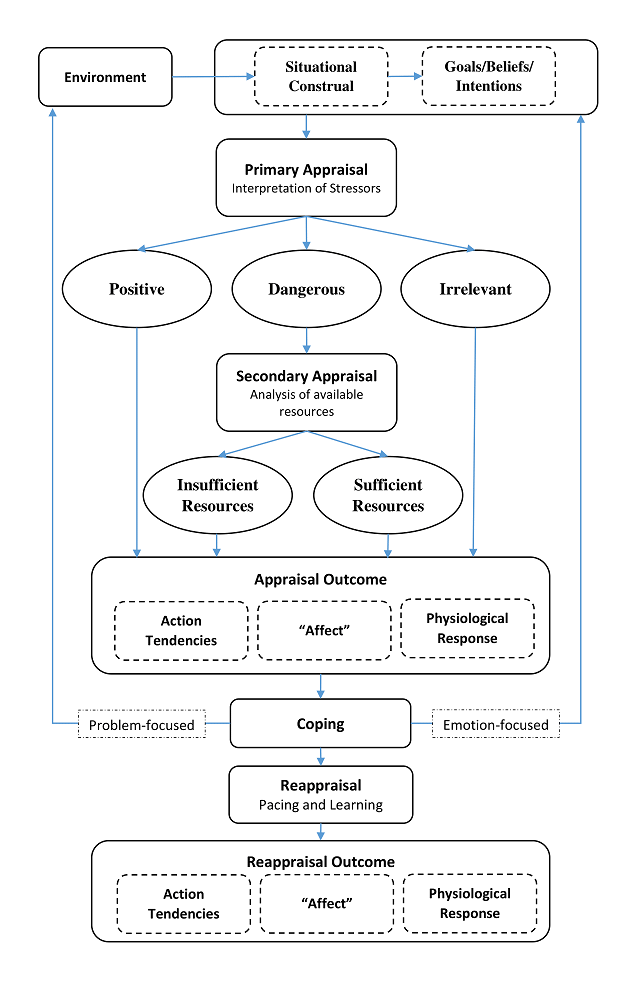 Diagram Appraisal Theory-1.png 632 × 988; 91 KB
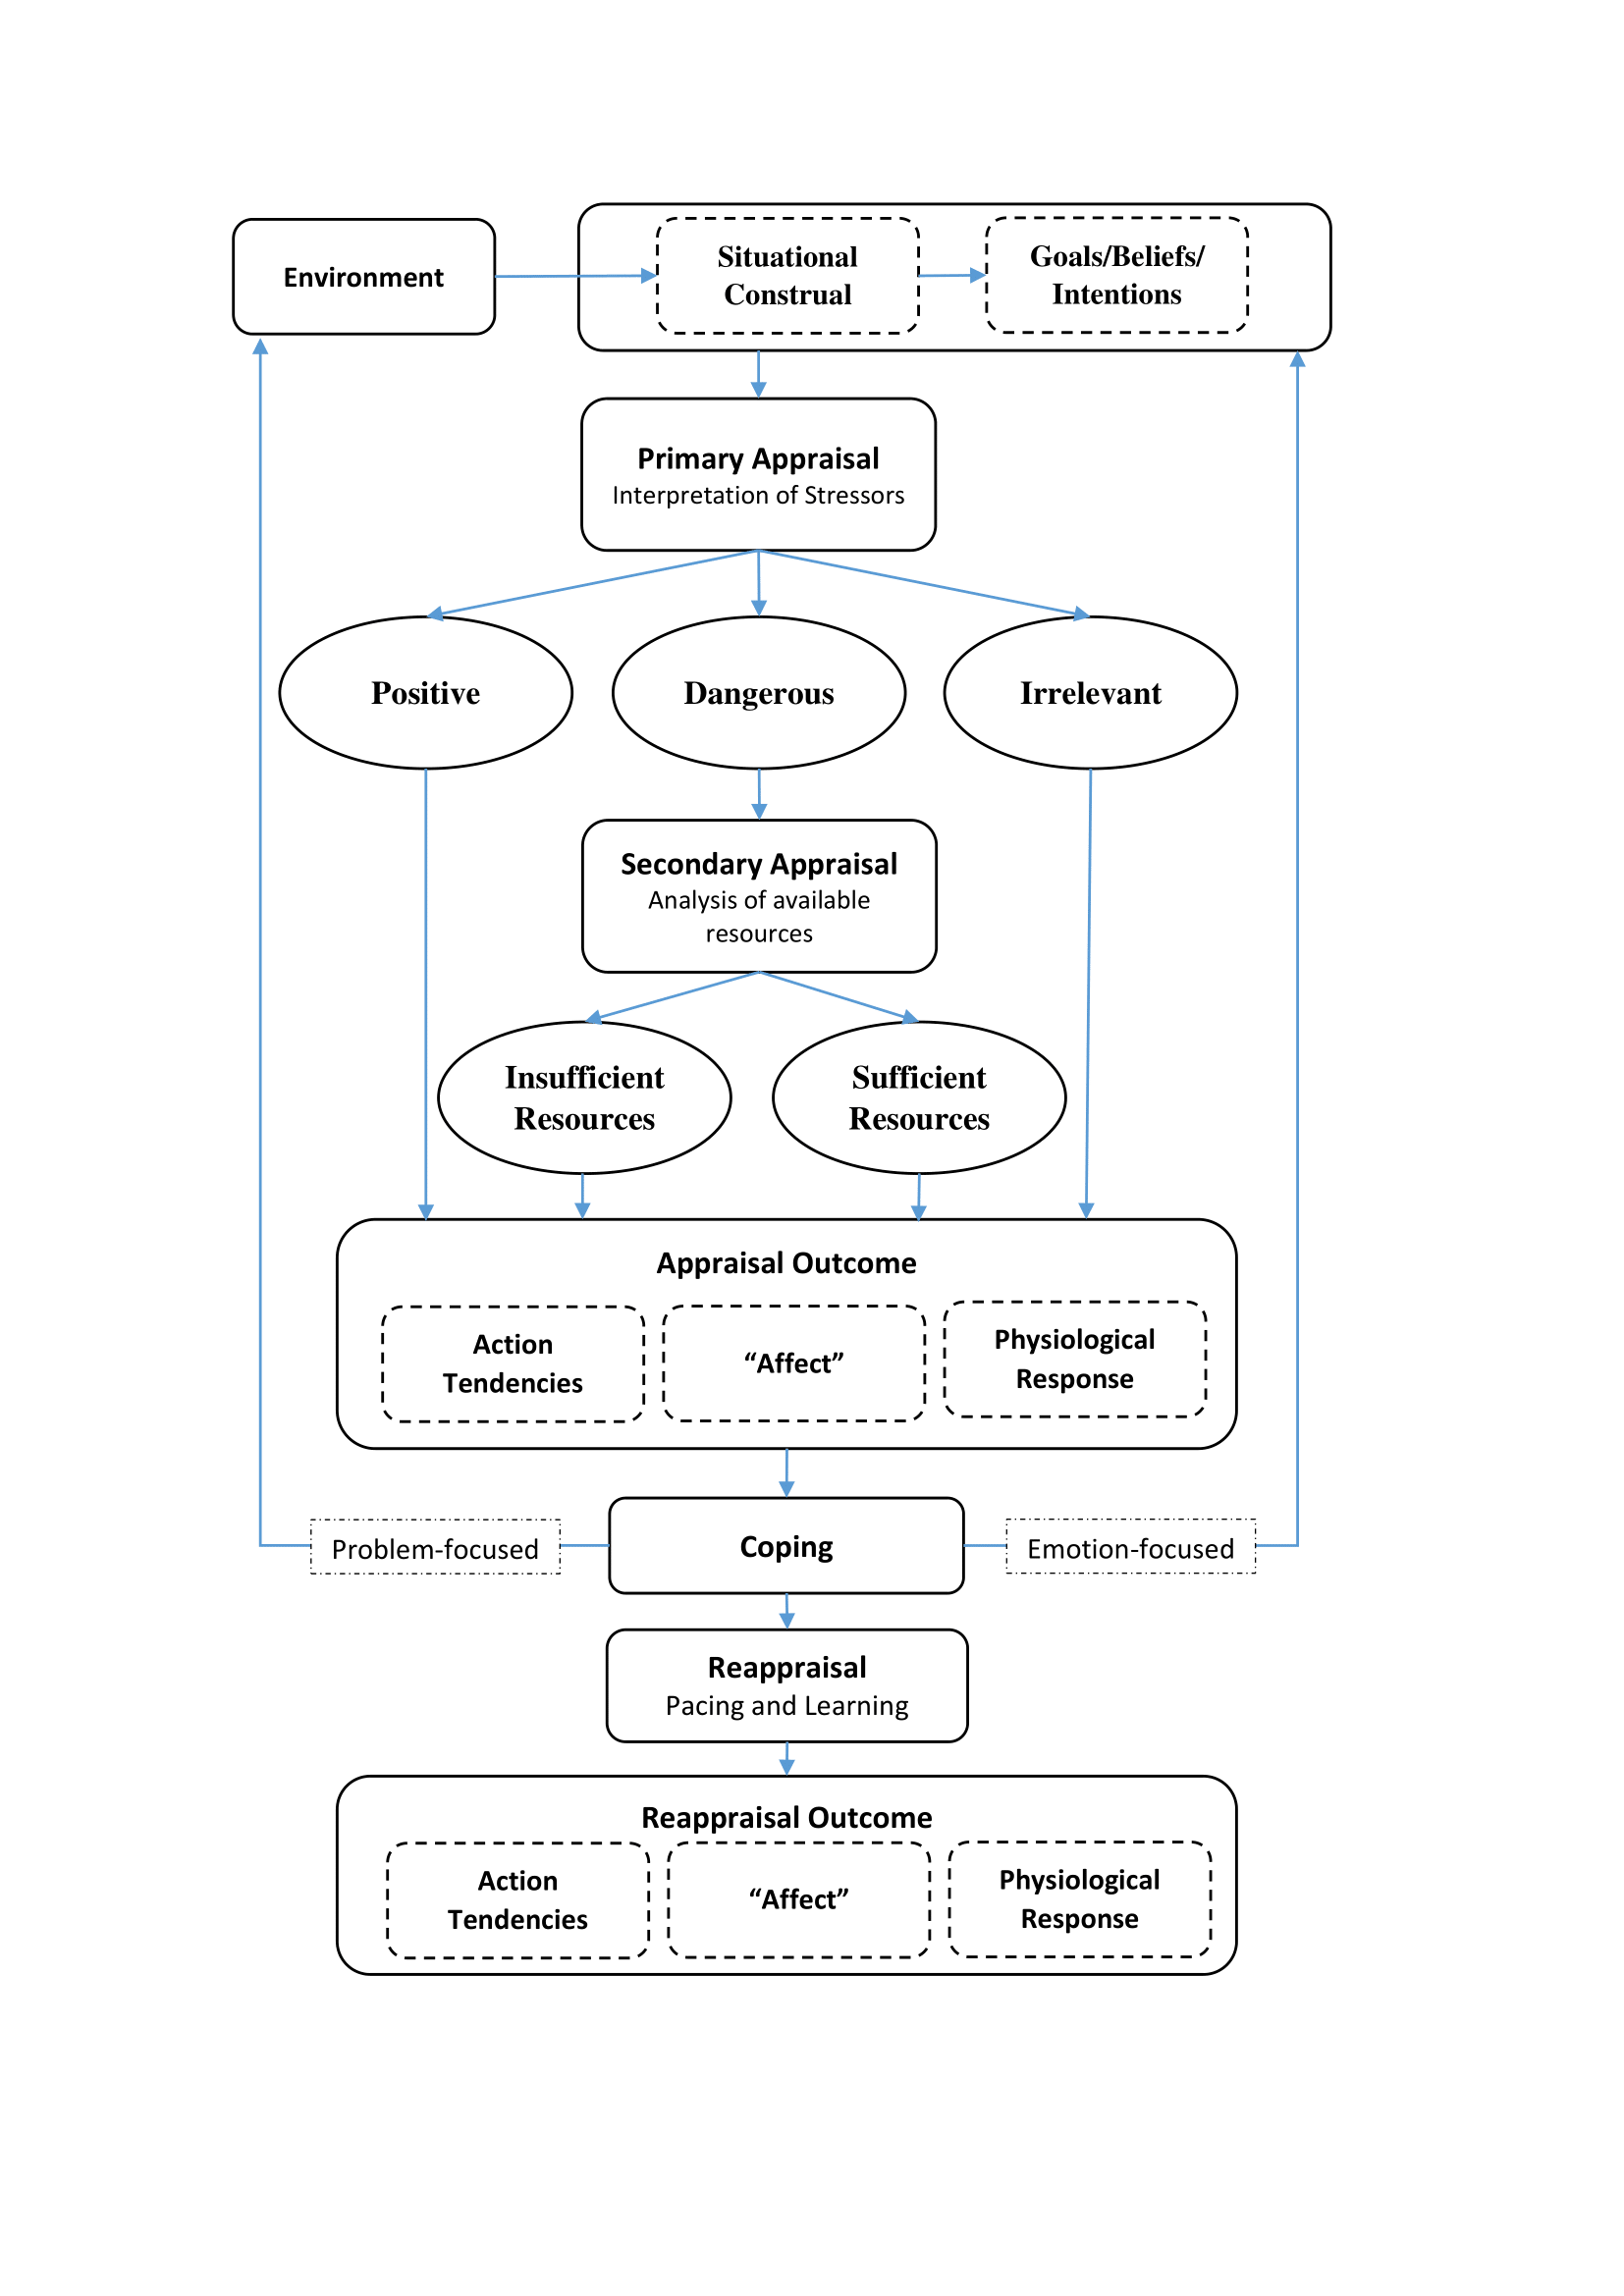 Diagram Appraisal Theory.png 1,654 × 2,339; 113 KB
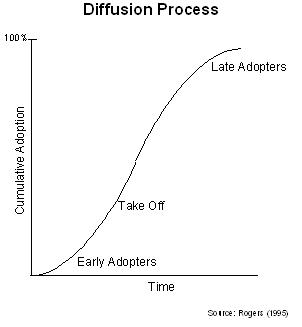
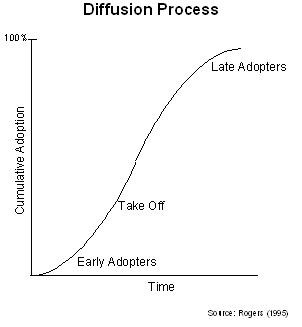 Diffusion process.jpg 302 × 327; 12 KB
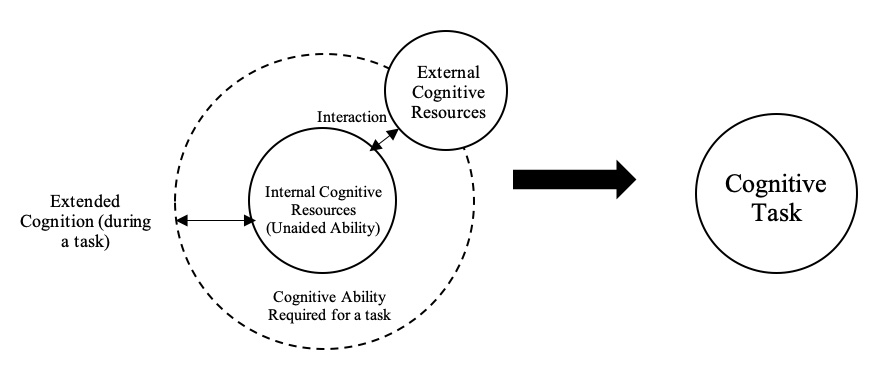 Distributed-cognition-theory.jpg 885 × 391; 56 KB
 Doi1.JPG 302 × 327; 9 KB
 Doi2.JPG 414 × 330; 16 KB
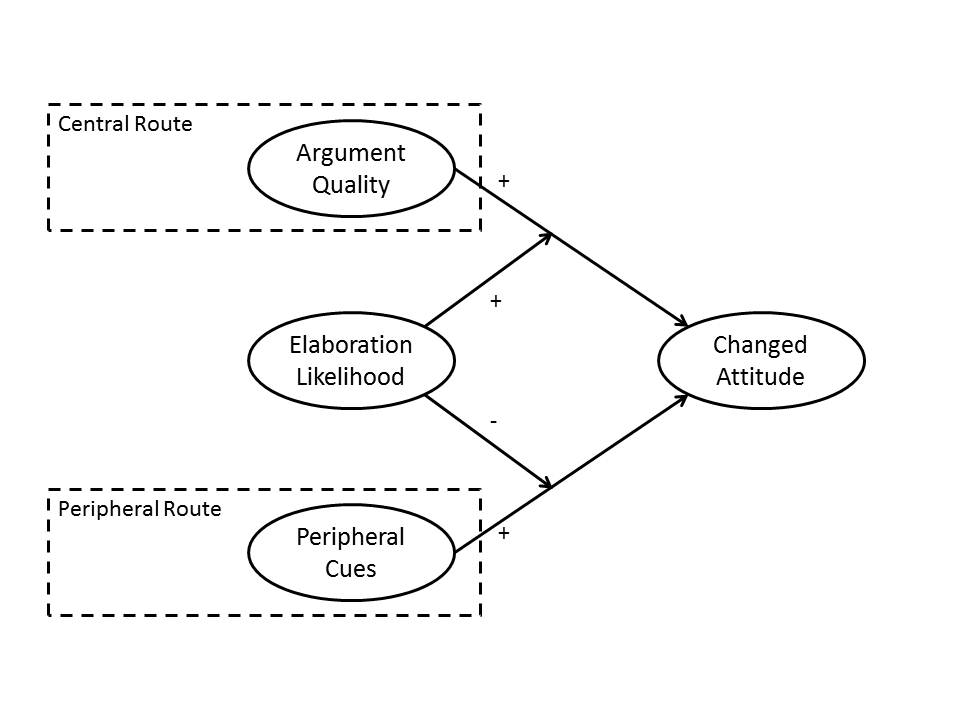 ELM GeneralModel.jpg 960 × 720; 41 KB
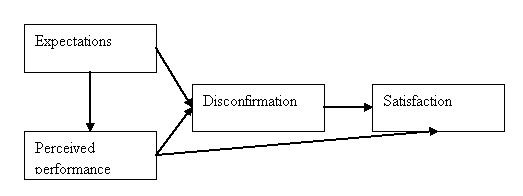 Ect.JPG 523 × 196; 11 KB
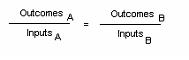 Equity1.JPG 189 × 60; 2 KB
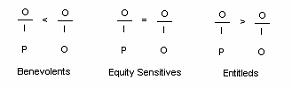 Equity2.JPG 293 × 91; 4 KB
 Example.jpg 688 × 400; 34 KB
 Example1.jpg 876 × 318; 36 KB
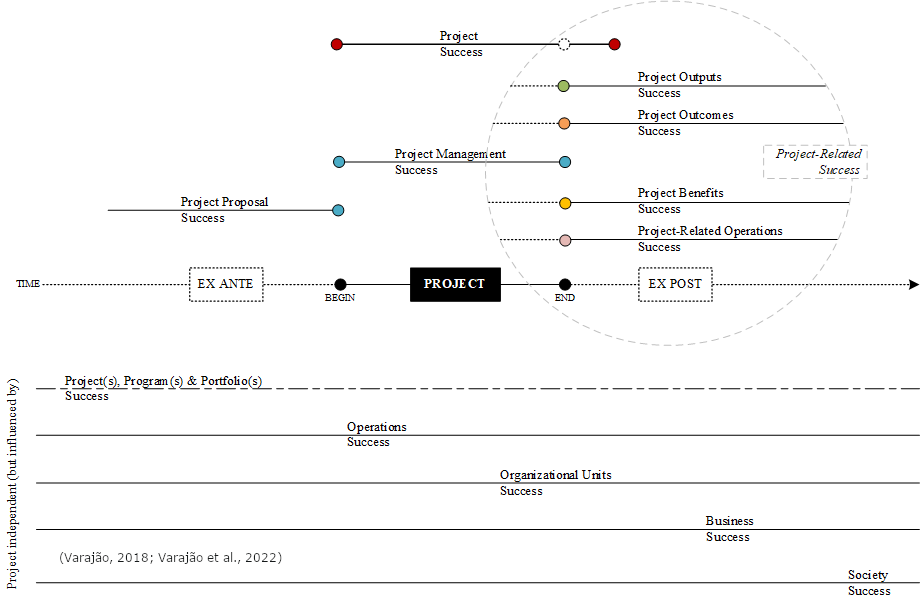 FacetsSuccess.png 921 × 605; 50 KB
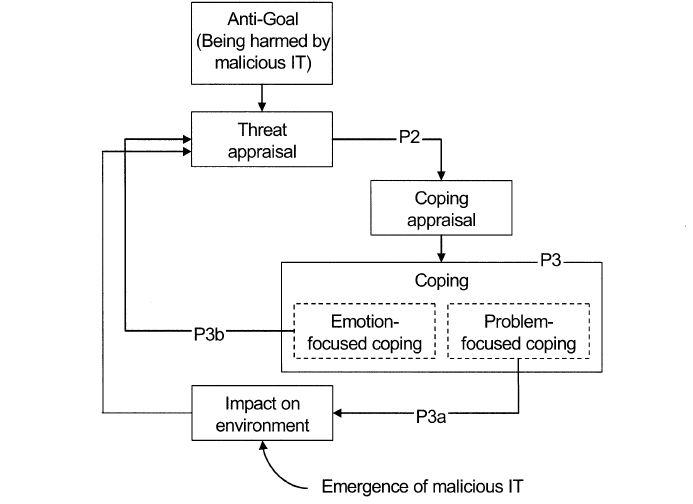 Figure 1- The Process of IT Threat Avoidance.jpg 693 × 504; 41 KB
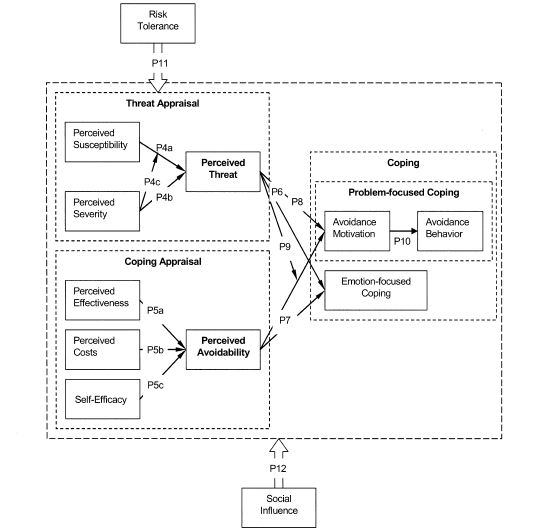 Figure 2- The Variance Theory View of TTAT.jpg 547 × 532; 48 KB
 Firm level internationalization.png 624 × 328; 54 KB
 Fvm.jpg 393 × 215; 19 KB
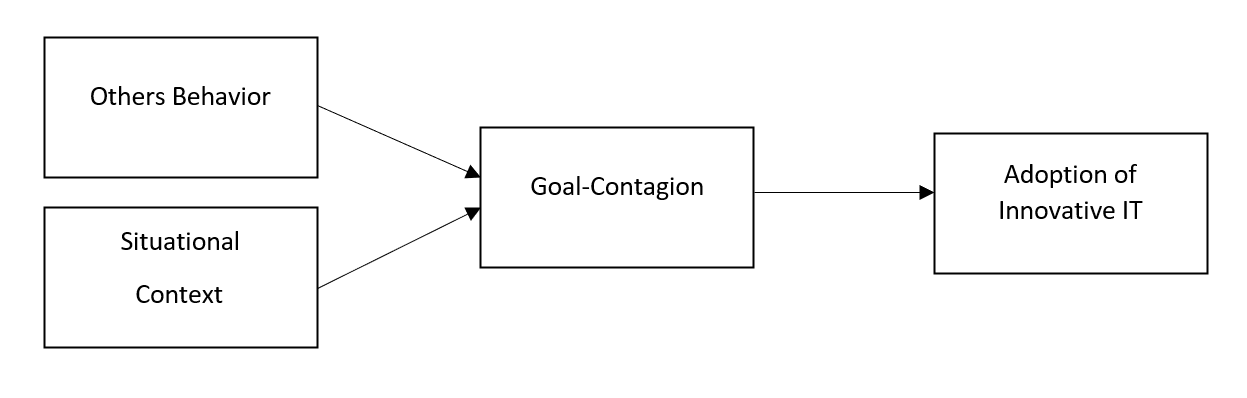 GCT Diagram.png 1,247 × 398; 15 KB
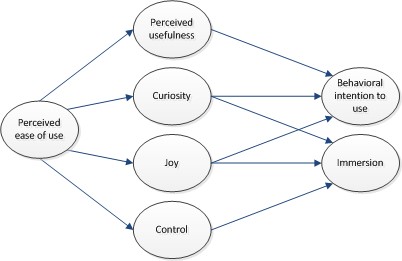 HMSAM overview.jpg 402 × 261; 21 KB
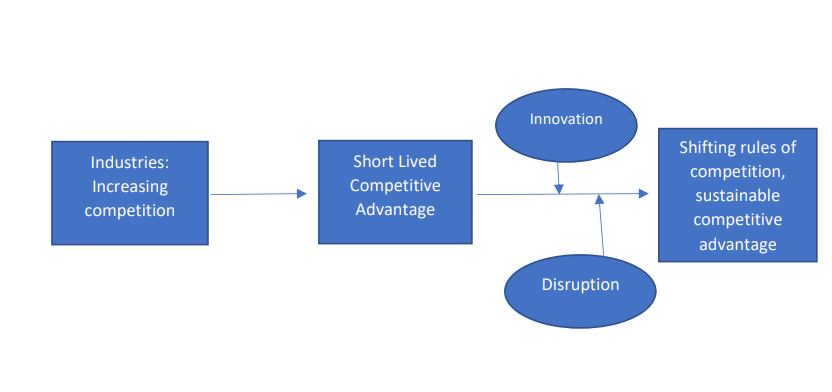 Hypercompetition diagram.png 832 × 392; 37 KB
 IMD-Web-Logo.png 217 × 92; 7 KB
 IMT.jpg 586 × 239; 14 KB
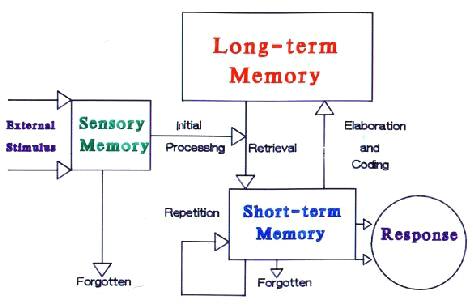 IPT1.JPG 473 × 305; 19 KB
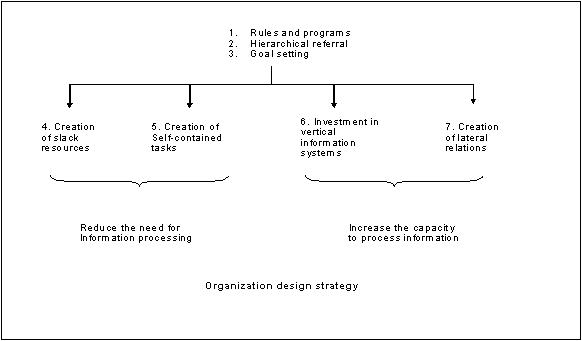 IPT2.JPG 582 × 341; 21 KB
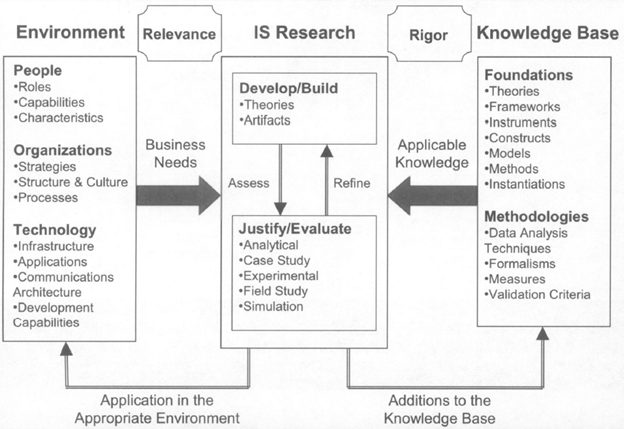 ISR.png 625 × 429; 212 KB
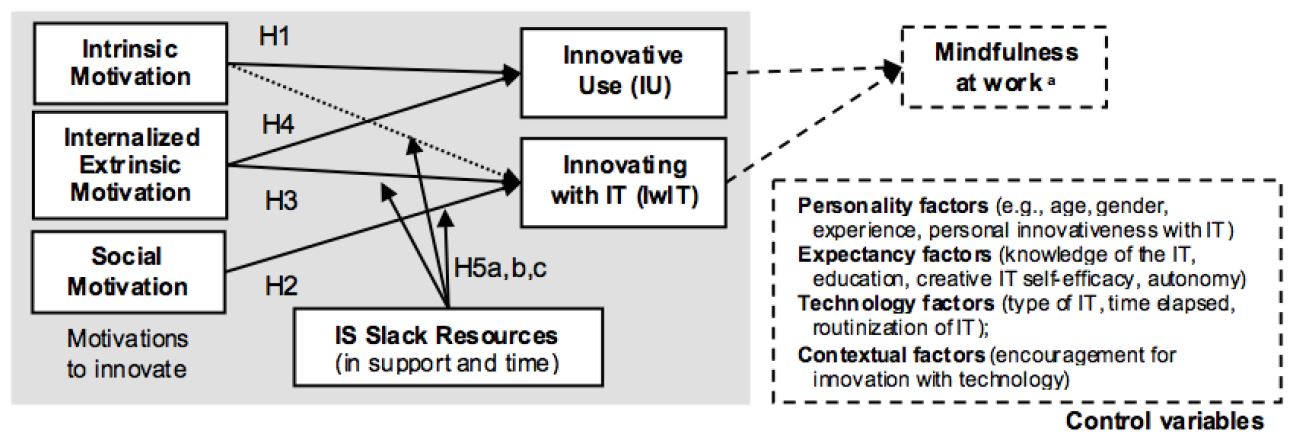 IS slack and innovation.jpg 1,297 × 442; 101 KB
 Image.png 624 × 420; 50 KB
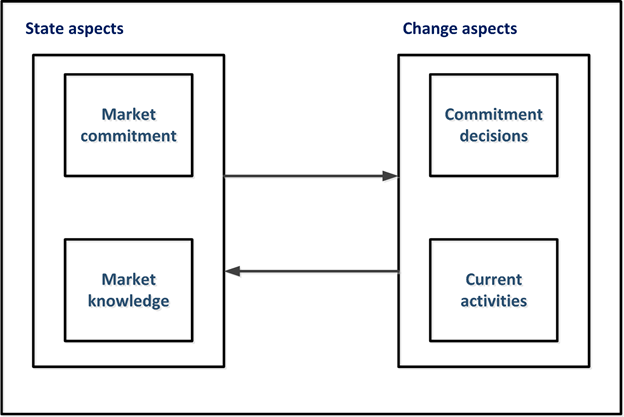 Internationalization Process.png 624 × 417; 38 KB
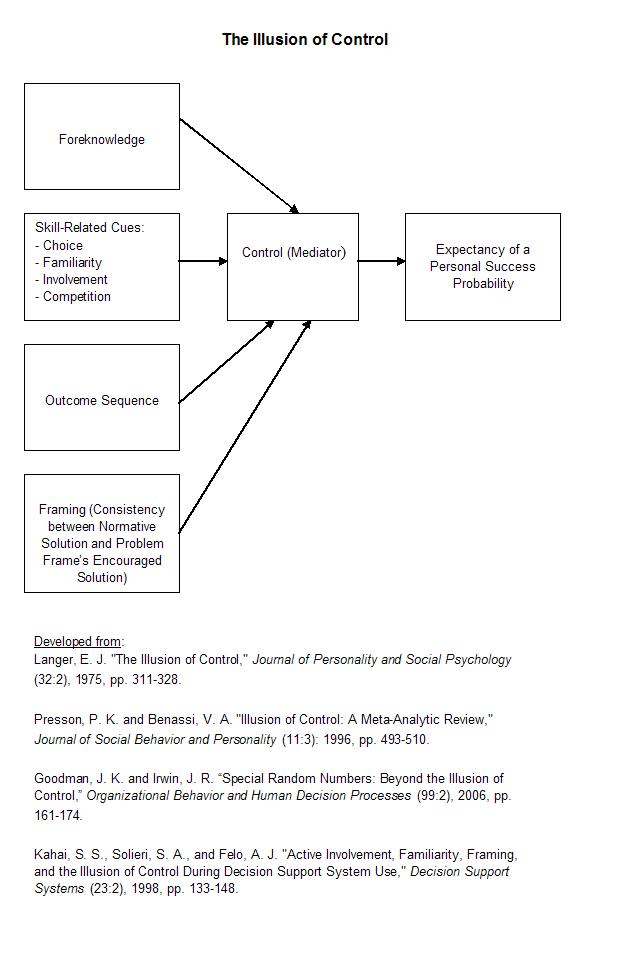 Ioc.JPG 640 × 961; 64 KB
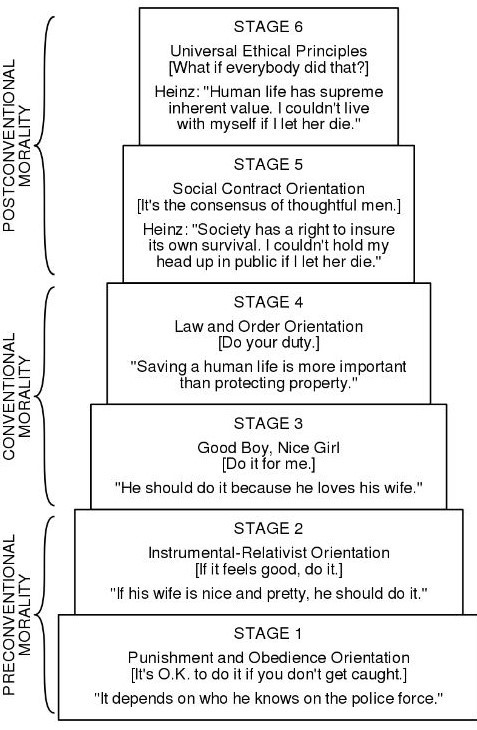 Kohlberg's stages of moral development.jpg 477 × 730; 128 KB
 MISC figure1.JPG 856 × 732; 91 KB
 MISC figure 1.JPG 856 × 732; 91 KB
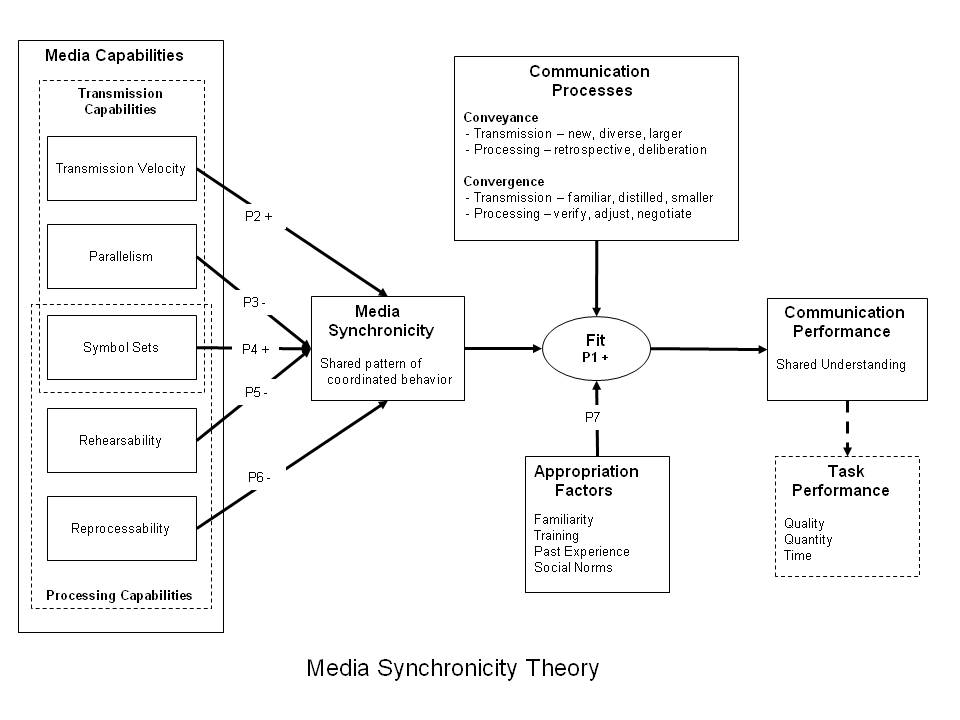 MST.jpg 960 × 720; 67 KB
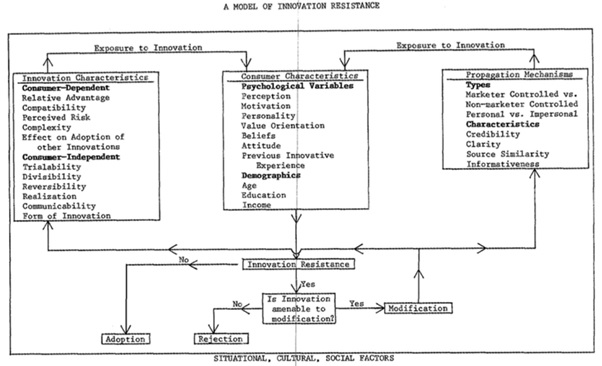 Model of IRT - Innovation Resistance Theory.jpg 602 × 366; 61 KB


