Uncategorized files
Jump to navigation
Jump to search
Showing below up to 135 results in range #1 to #135.
View (previous 250 | next 250) (20 | 50 | 100 | 250 | 500)
 1.jpg 1,842 × 1,086; 67 KB
 2000px-BYU Medallion Logo.svg.png 2,000 × 2,000; 425 KB
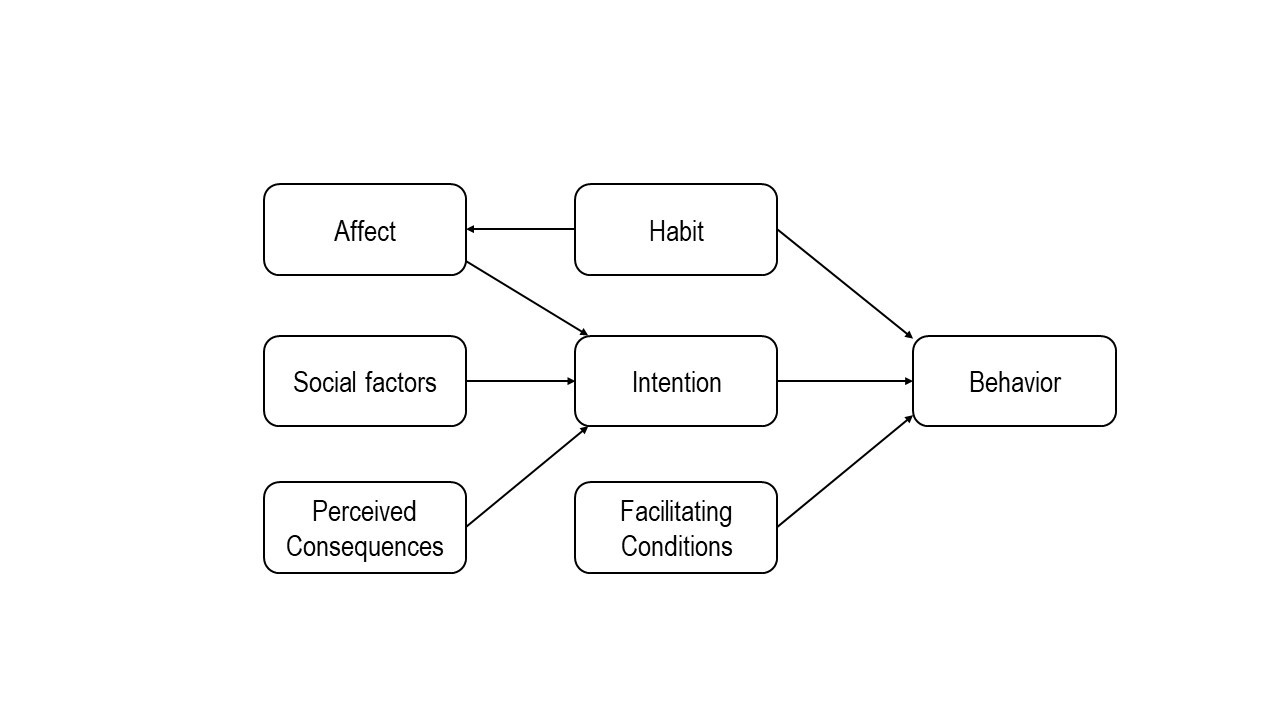 3.TIB.jpg 1,280 × 720; 51 KB
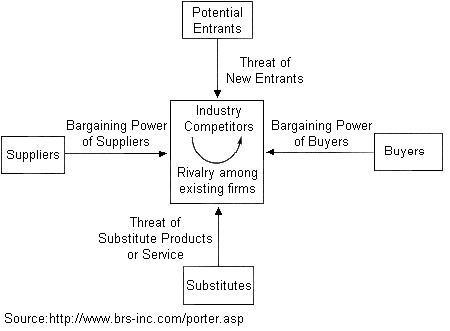 5forces2.JPG 450 × 331; 20 KB
 AIS.jpg 134 × 22; 3 KB
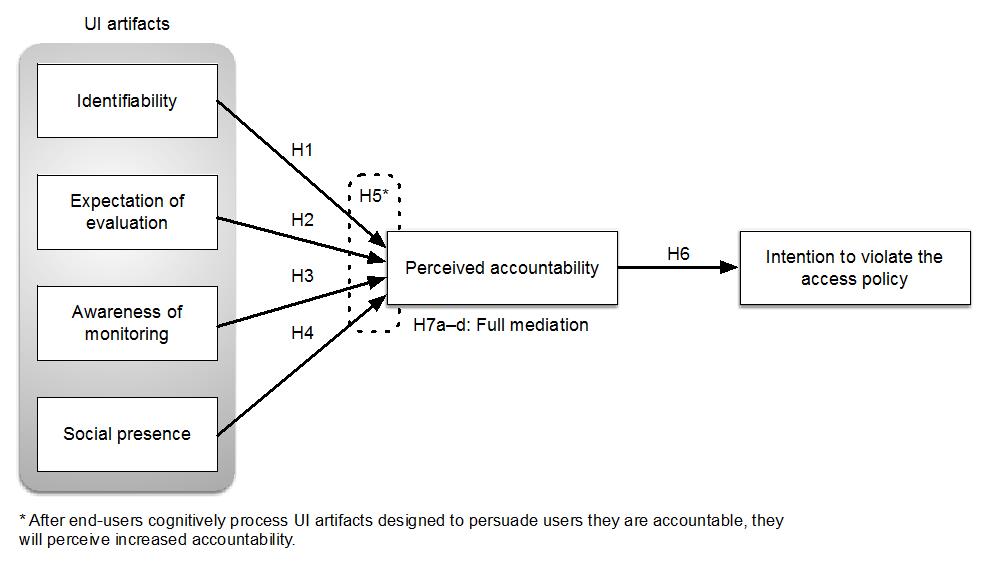 Accountability figure1.jpg 991 × 562; 50 KB
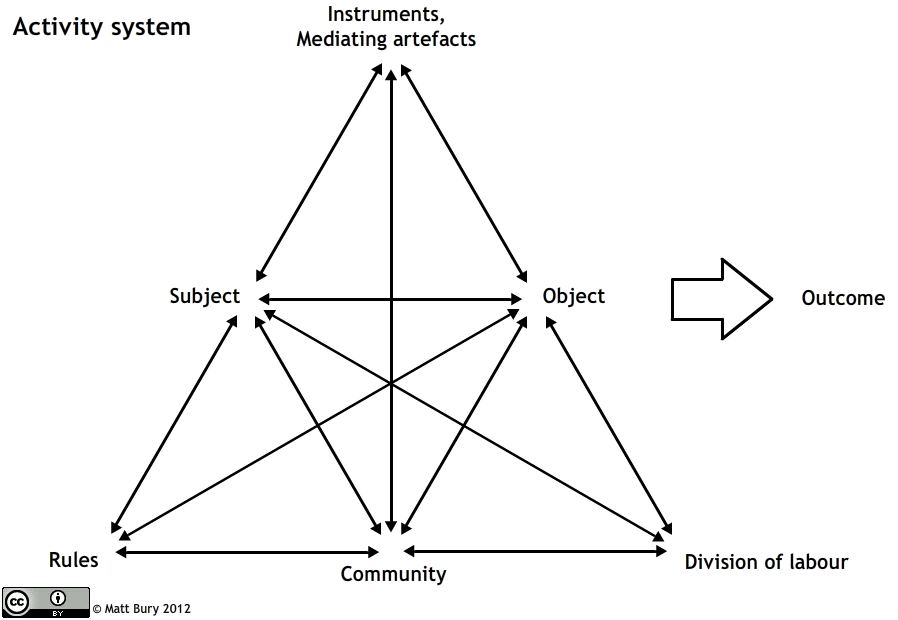 Activity Theory.png 898 × 620; 45 KB
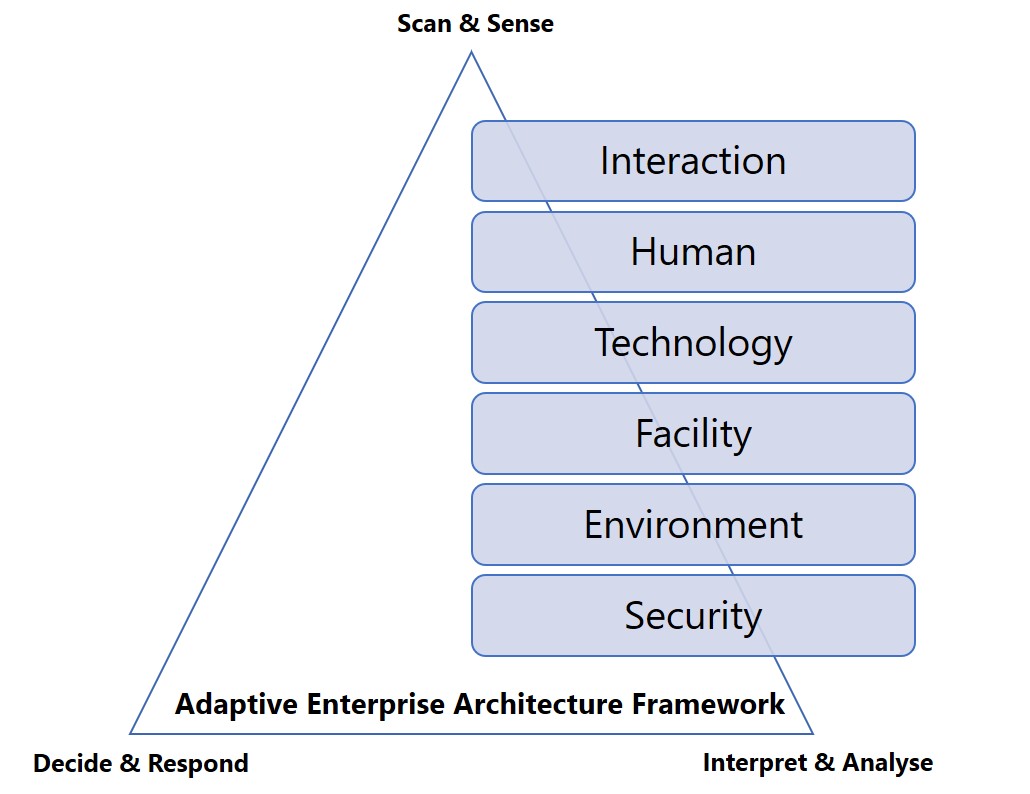 Adaptive EA Framework.jpg 1,030 × 794; 86 KB
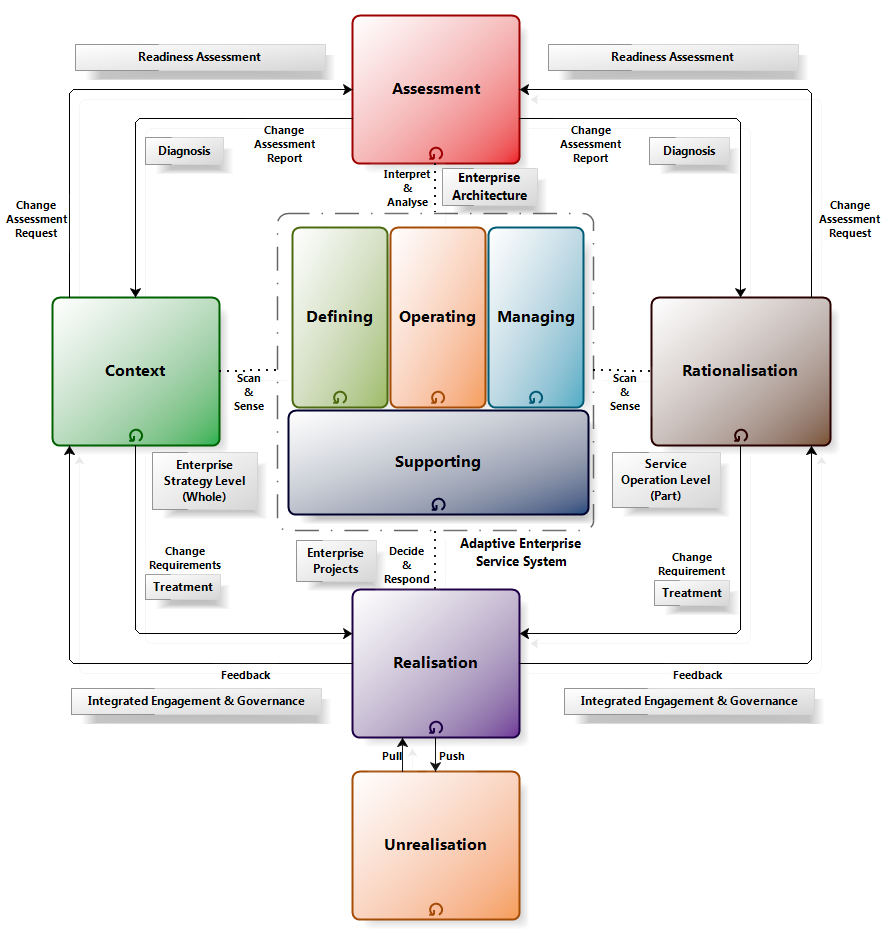 Adaptive Enterprise Architecture Theory.png 886 × 932; 142 KB
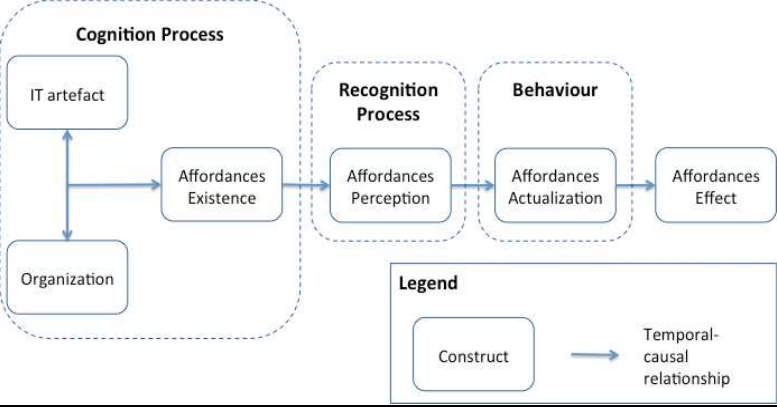 Affordance-actualization theory.png 777 × 407; 157 KB
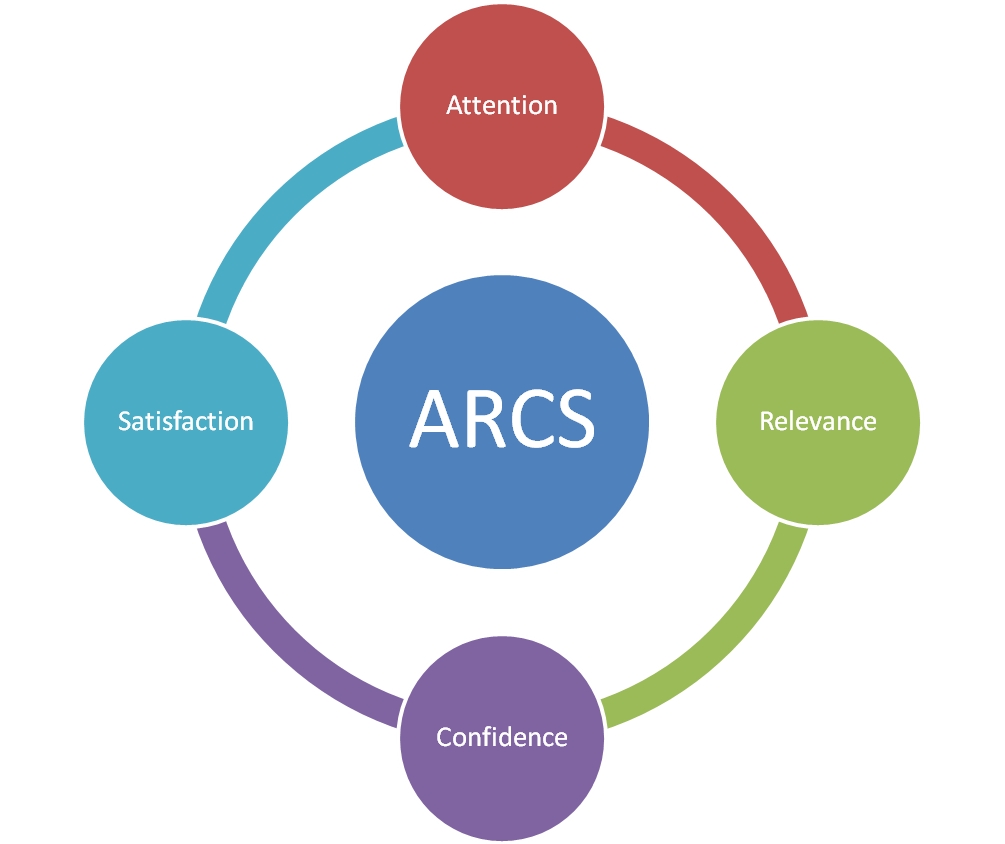 Arcs.jpeg 1,005 × 844; 124 KB
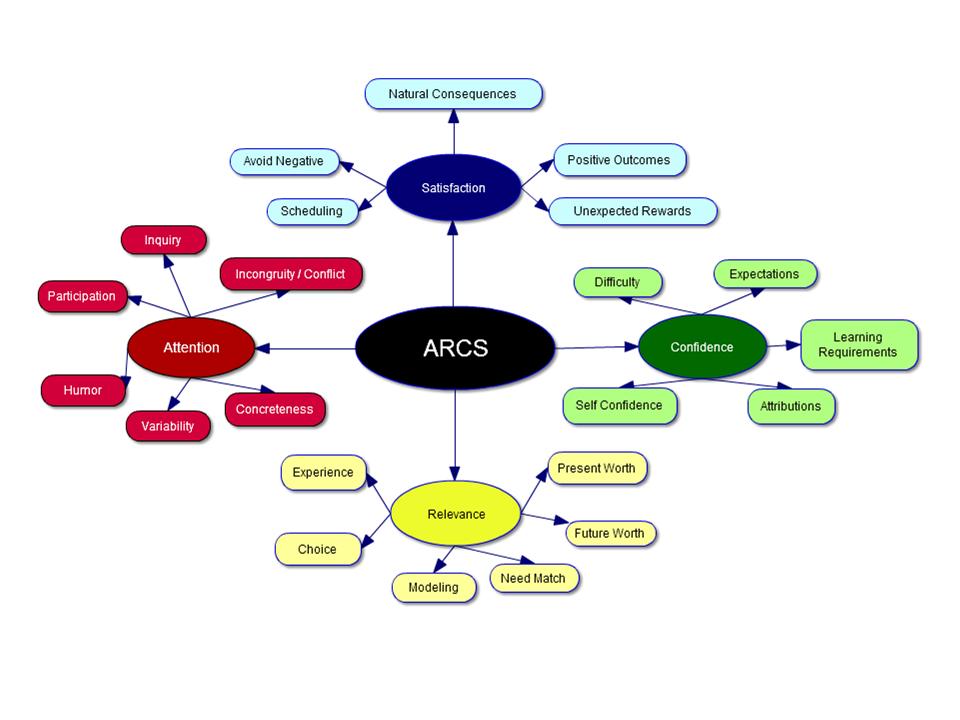 Arcs constructs.jpg 960 × 720; 56 KB
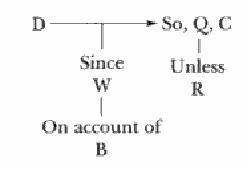 Arg.JPG 248 × 174; 5 KB
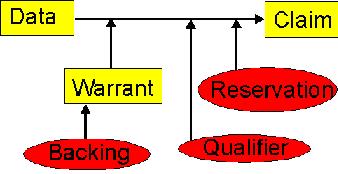 Arg2.JPG 338 × 174; 13 KB
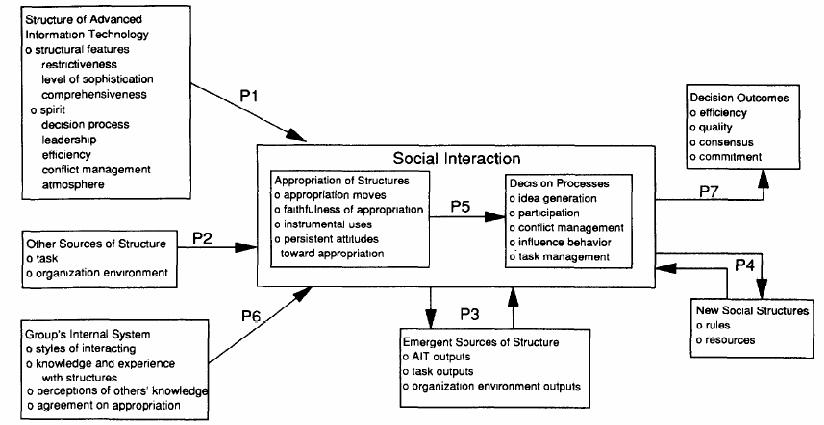 Ast.JPG 824 × 425; 58 KB
 BAO.jpg 352 × 201; 16 KB
 BWIdYTM.jpg 1,920 × 1,080; 188 KB
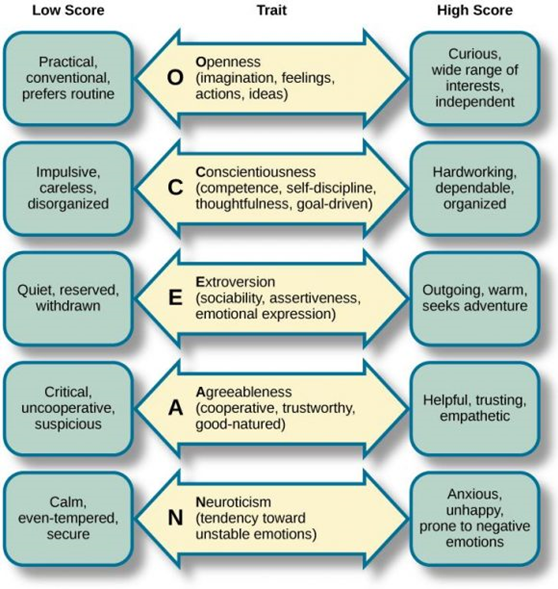 Big Five Factors of Personality.png 558 × 589; 506 KB
 Byuwordmark.png 4,725 × 2,175; 82 KB
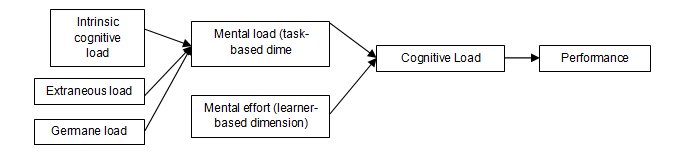 CLT.jpg 673 × 159; 16 KB
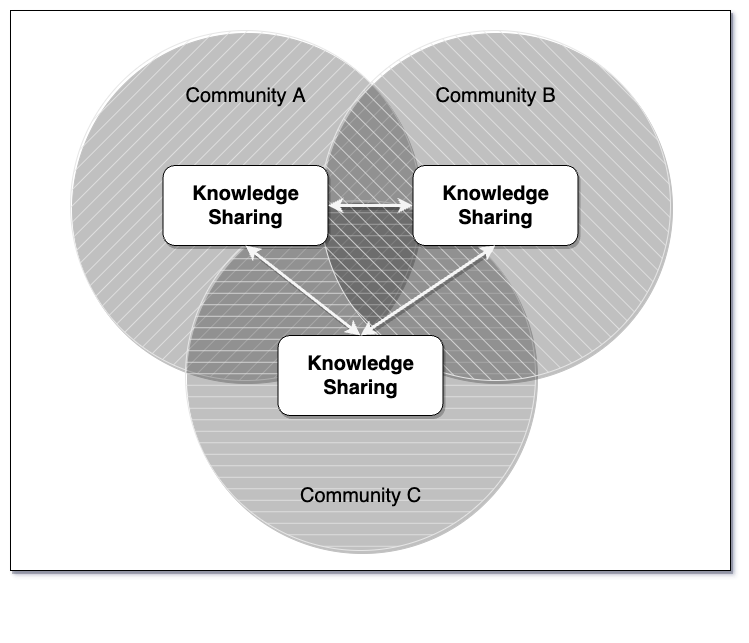 COP.png 749 × 643; 77 KB
 COR.jpg 657 × 491; 34 KB
 CRT.jpg 429 × 404; 23 KB
 Cdt.JPG 491 × 260; 21 KB
 Cdt2.JPG 636 × 288; 56 KB
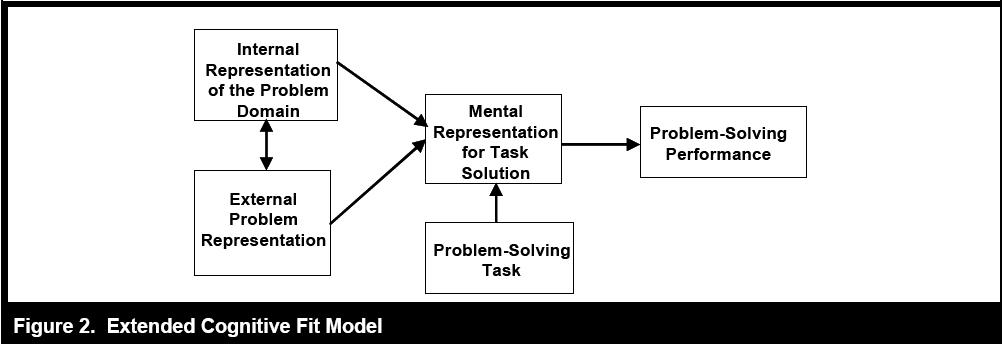 Cfit.JPG 1,002 × 344; 33 KB
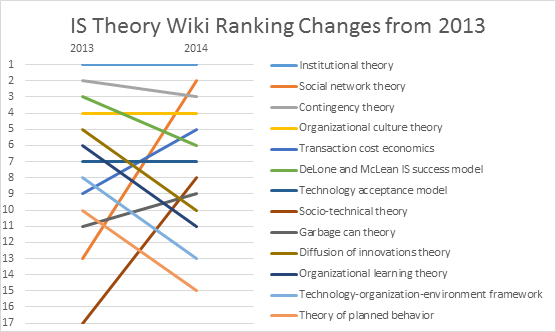 Chart-v1.png 556 × 332; 24 KB
 Coloradouniversity.jpg 576 × 576; 178 KB
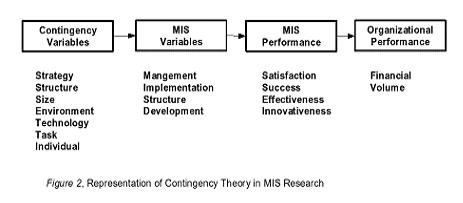 Cont1.JPG 463 × 203; 14 KB
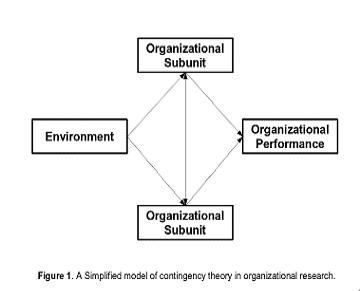 Cont2.JPG 363 × 291; 11 KB
 Cse.JPG 682 × 551; 43 KB
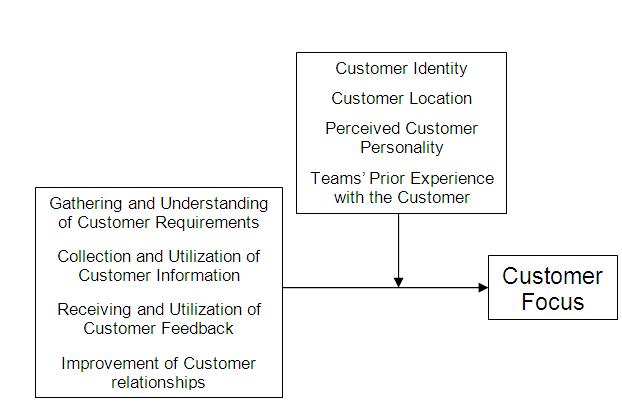 Customer Focus Model.jpg 622 × 420; 33 KB
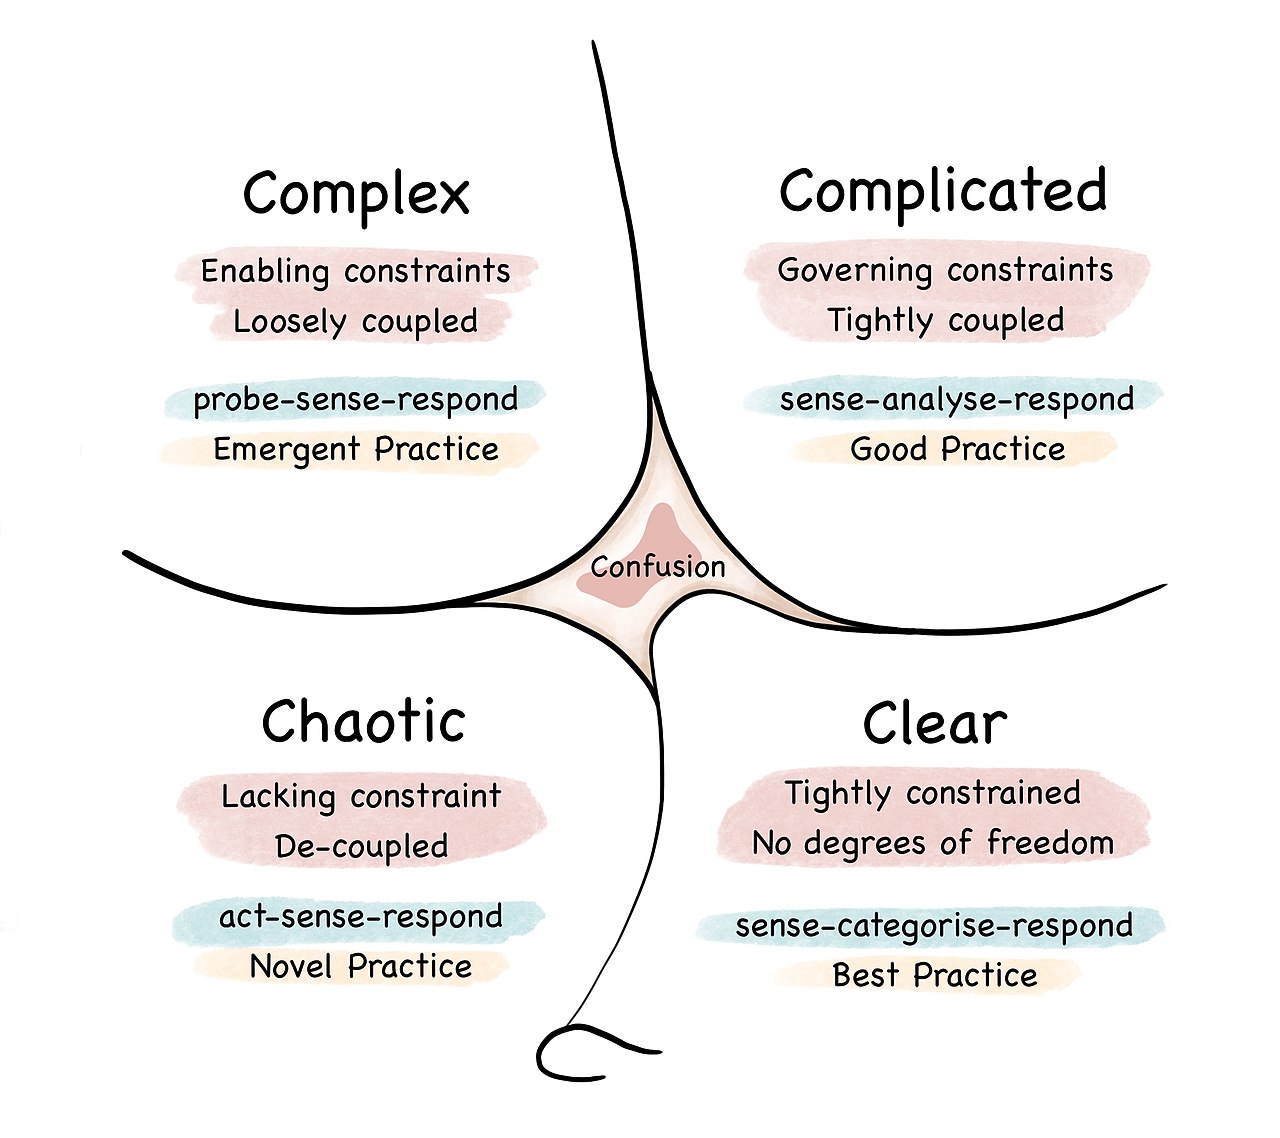 Cynefin framework 2022.jpg 1,280 × 1,138; 152 KB
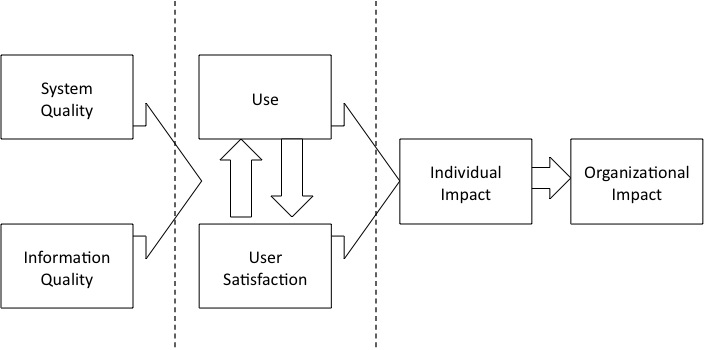 D&M1992.jpg 704 × 350; 35 KB
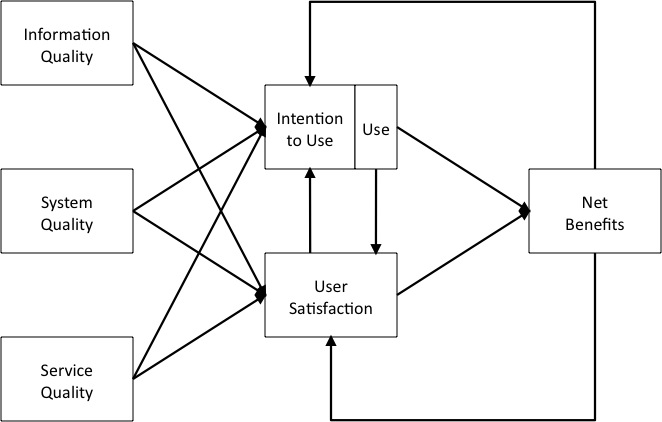 D&M2002.jpg 662 × 422; 40 KB
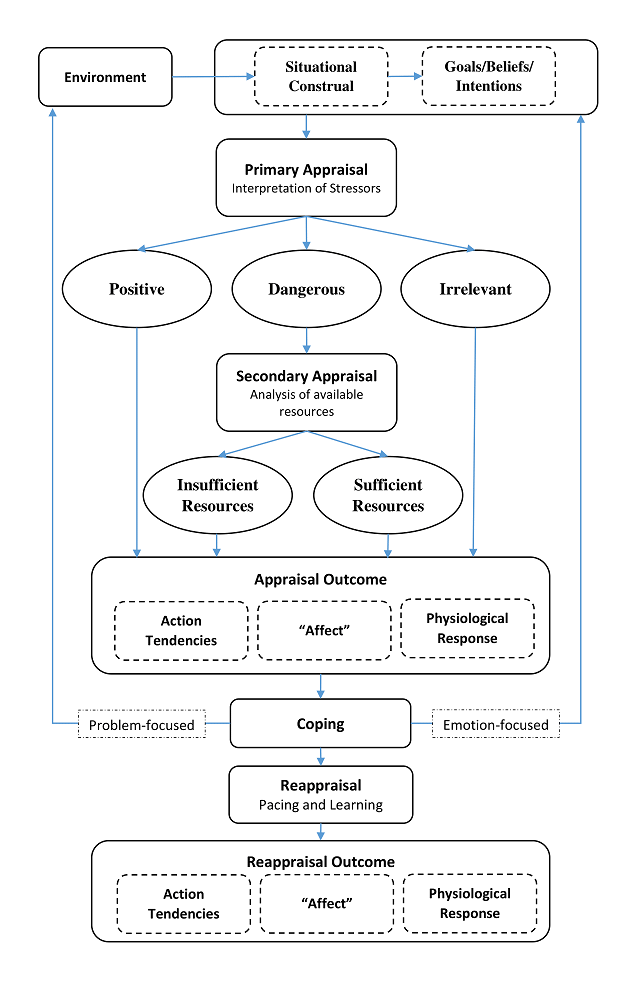 Diagram Appraisal Theory-1.png 632 × 988; 91 KB
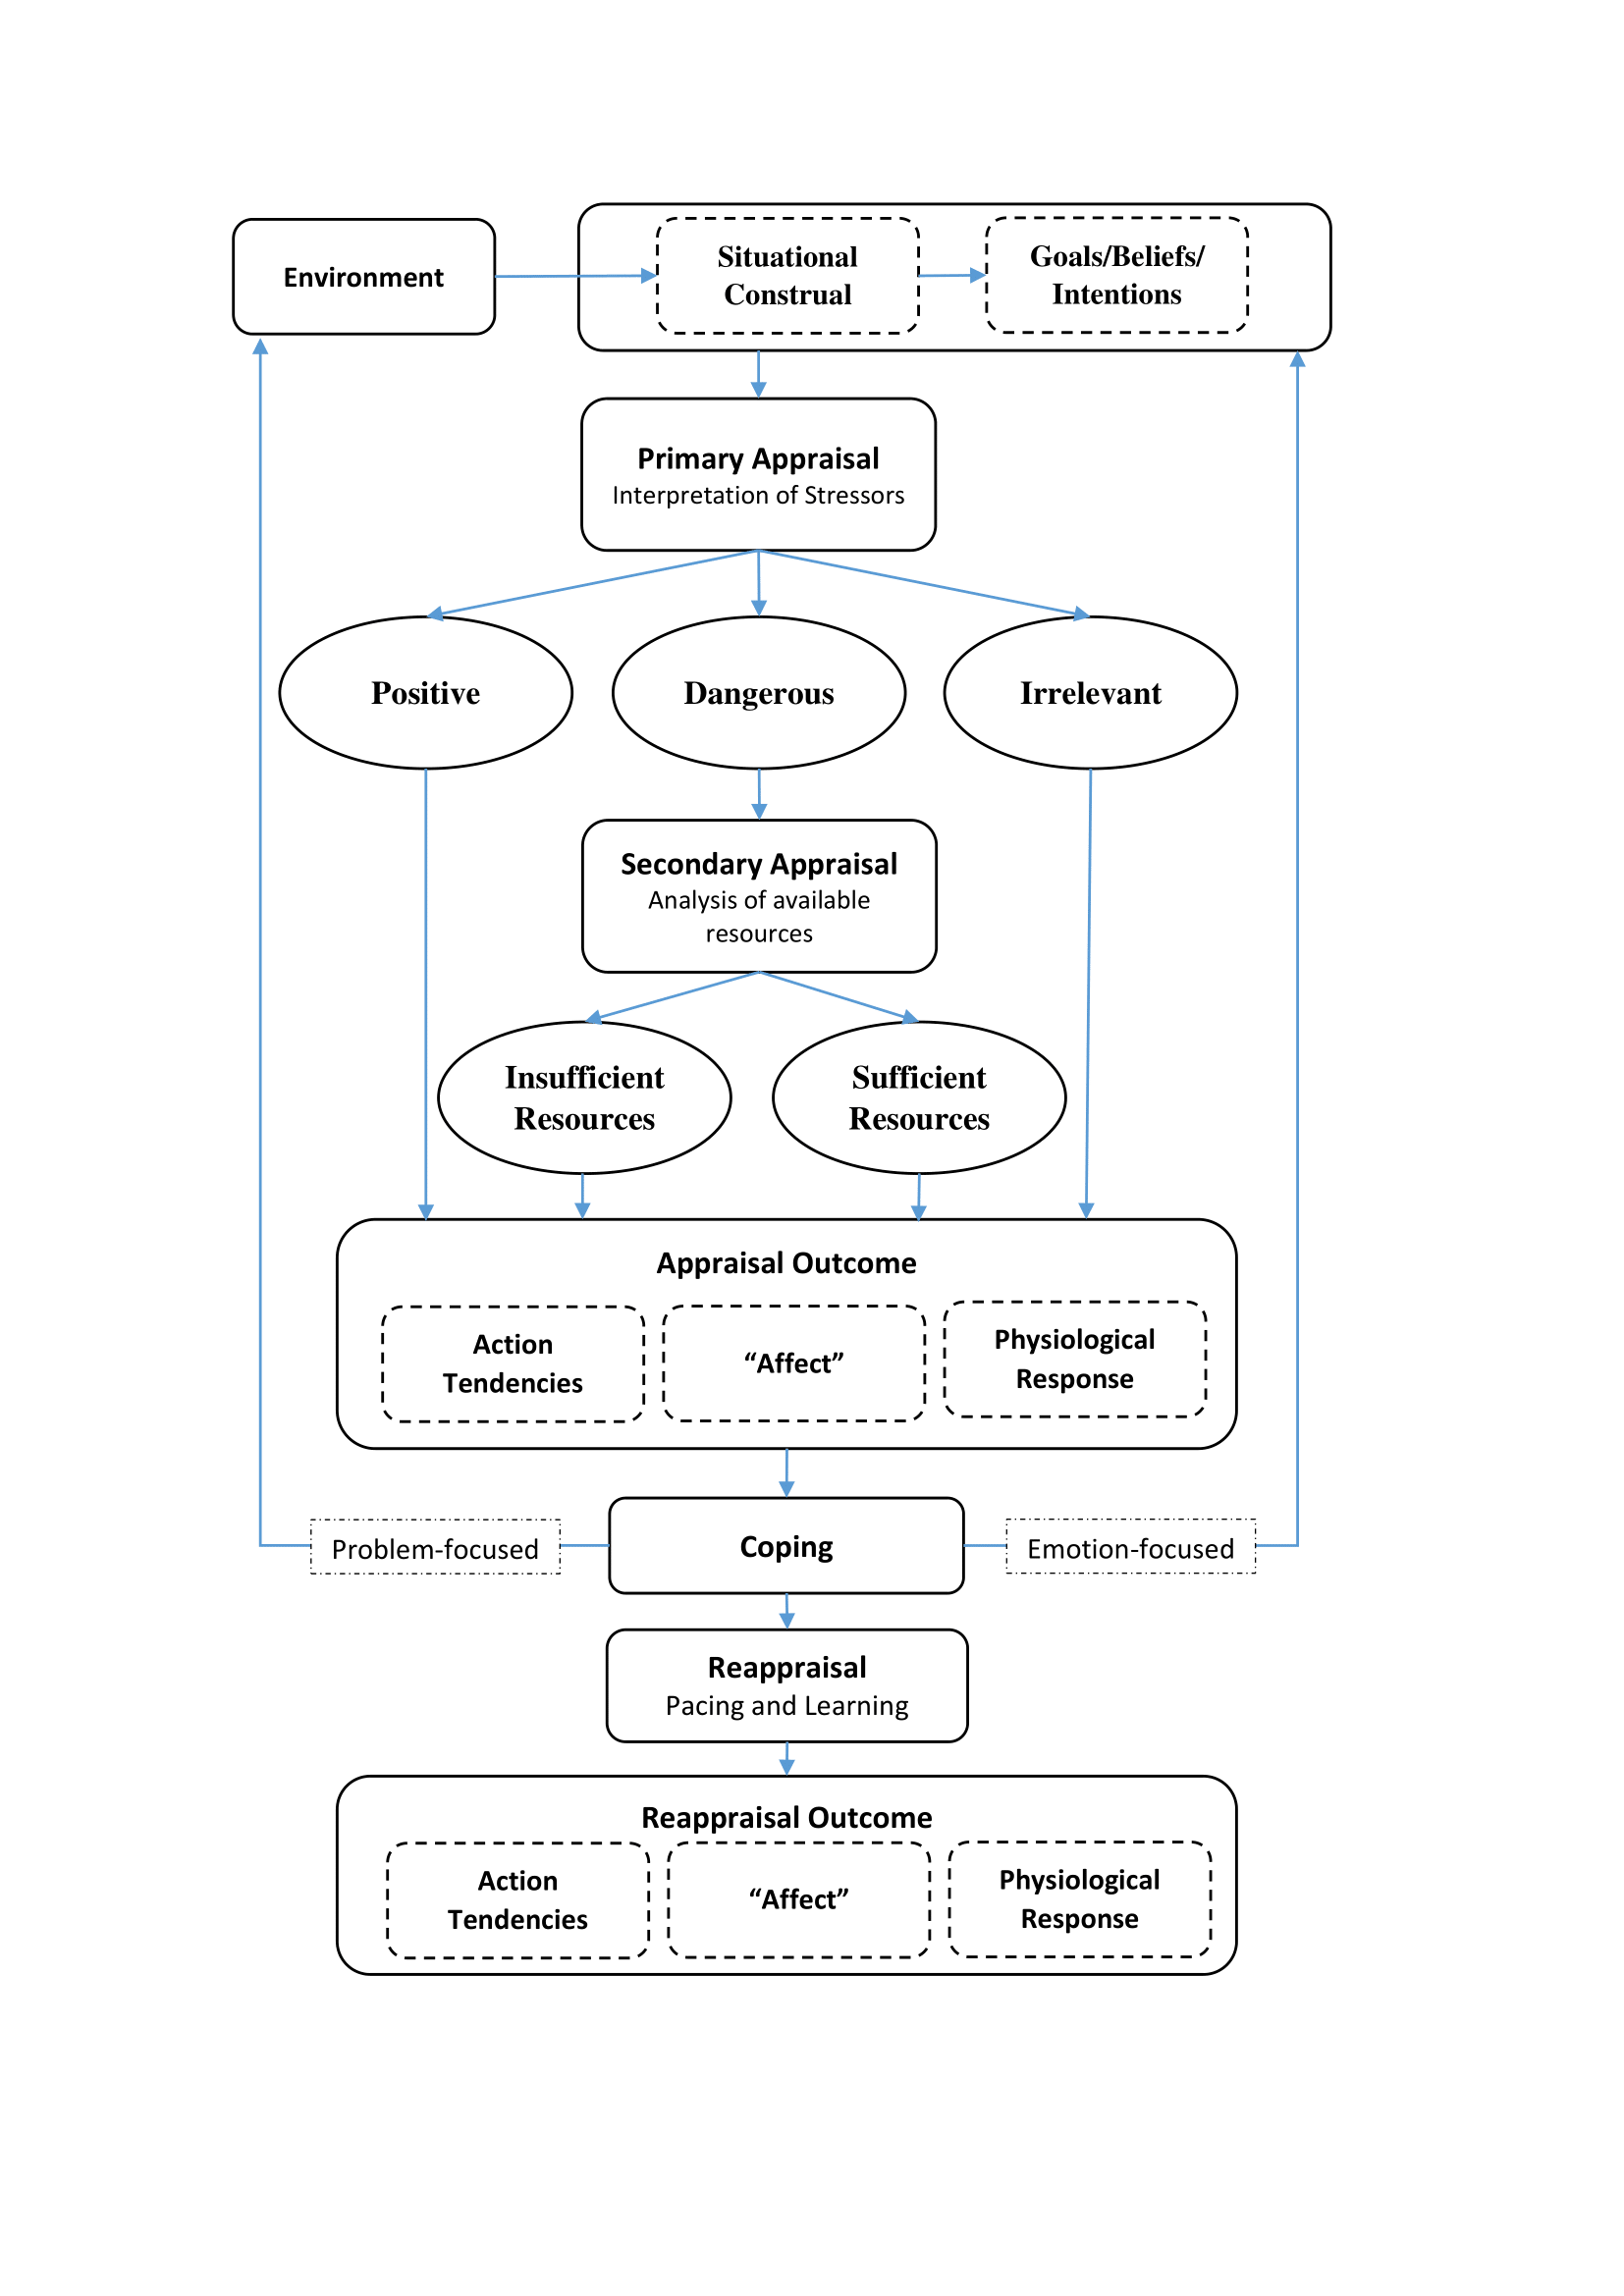 Diagram Appraisal Theory.png 1,654 × 2,339; 113 KB
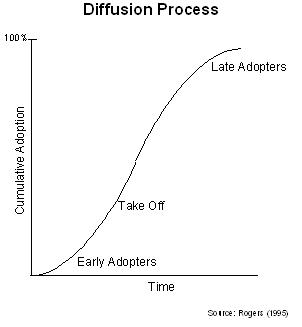
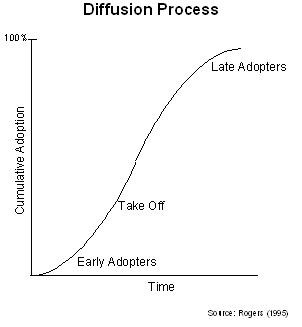 Diffusion process.jpg 302 × 327; 12 KB
 Distributed-cognition-theory.jpg 885 × 391; 56 KB
 Doi1.JPG 302 × 327; 9 KB
 Doi2.JPG 414 × 330; 16 KB
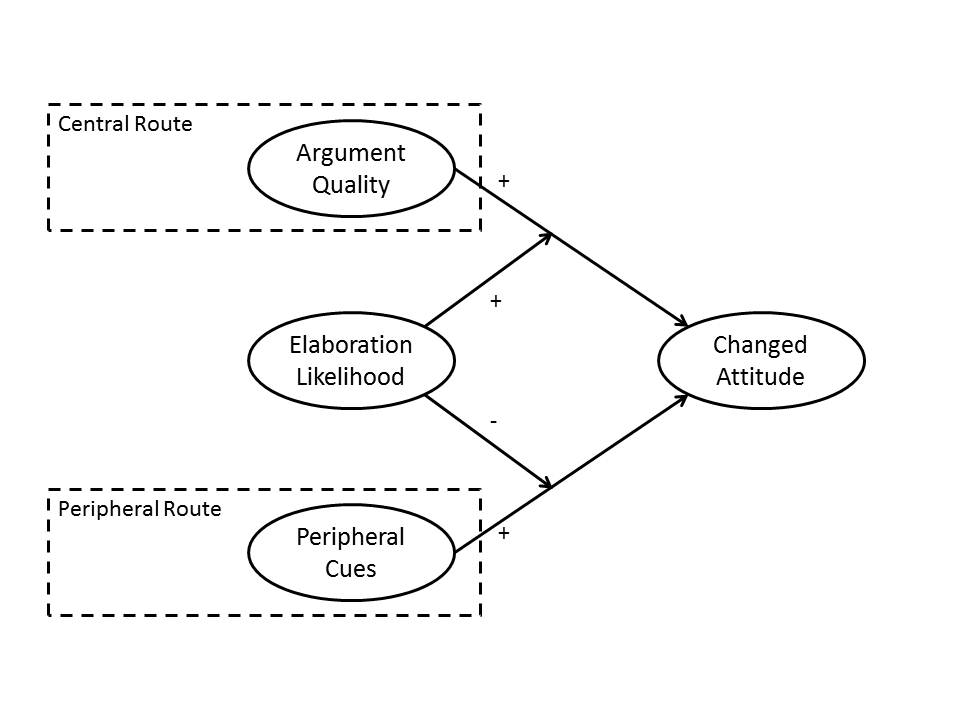 ELM GeneralModel.jpg 960 × 720; 41 KB
 Ect.JPG 523 × 196; 11 KB
 Equity1.JPG 189 × 60; 2 KB
 Equity2.JPG 293 × 91; 4 KB
 Example.jpg 688 × 400; 34 KB
 Example1.jpg 876 × 318; 36 KB
 FacetsSuccess.png 921 × 605; 50 KB
 Figure 1- The Process of IT Threat Avoidance.jpg 693 × 504; 41 KB
 Figure 2- The Variance Theory View of TTAT.jpg 547 × 532; 48 KB
 Firm level internationalization.png 624 × 328; 54 KB
 Fvm.jpg 393 × 215; 19 KB
 GCT Diagram.png 1,247 × 398; 15 KB
 HMSAM overview.jpg 402 × 261; 21 KB
 Hypercompetition diagram.png 832 × 392; 37 KB
 IMD-Web-Logo.png 217 × 92; 7 KB
 IMT.jpg 586 × 239; 14 KB
 IPT1.JPG 473 × 305; 19 KB
 IPT2.JPG 582 × 341; 21 KB
 ISR.png 625 × 429; 212 KB
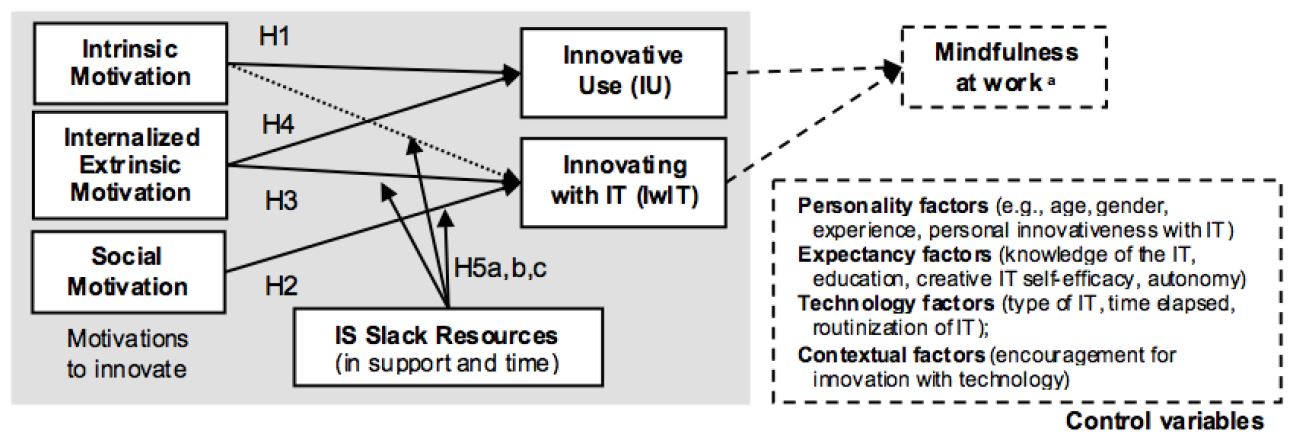 IS slack and innovation.jpg 1,297 × 442; 101 KB
 Image.png 624 × 420; 50 KB
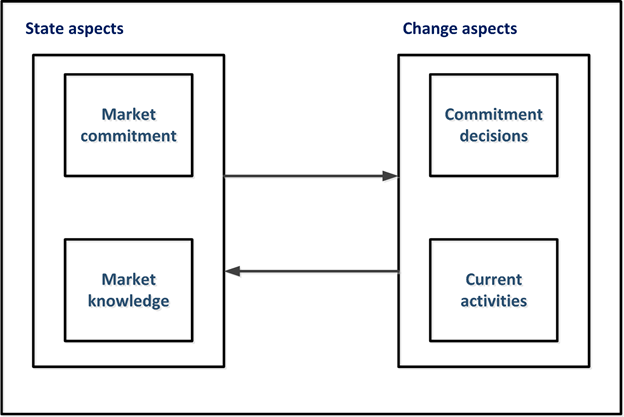 Internationalization Process.png 624 × 417; 38 KB
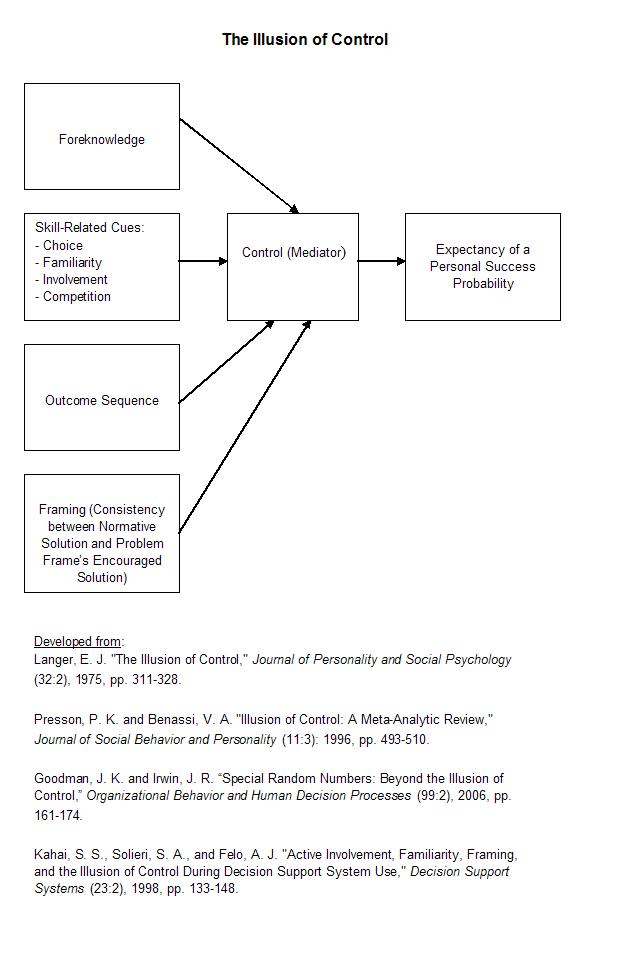 Ioc.JPG 640 × 961; 64 KB
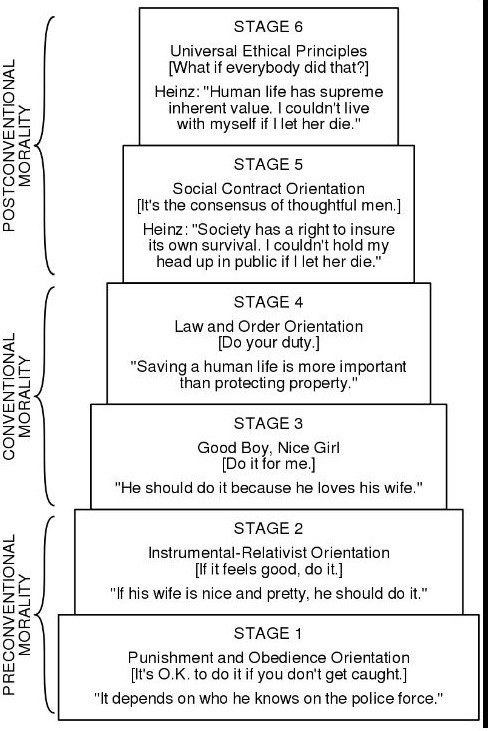
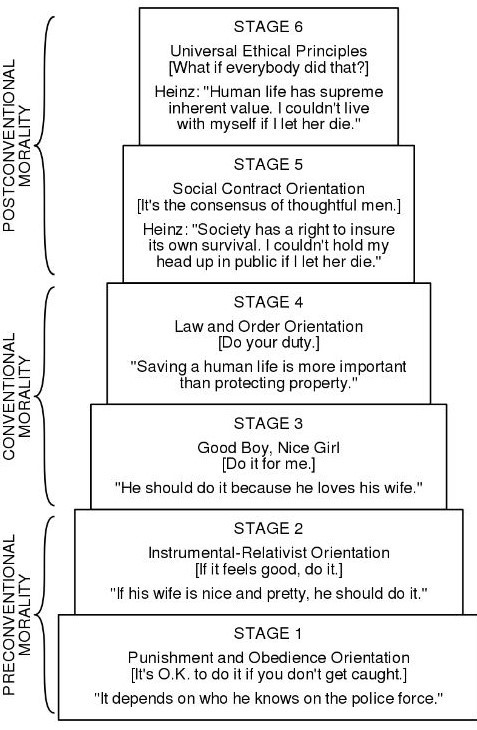 Kohlberg's stages of moral development.jpg 477 × 730; 128 KB
 MISC figure1.JPG 856 × 732; 91 KB
 MISC figure 1.JPG 856 × 732; 91 KB
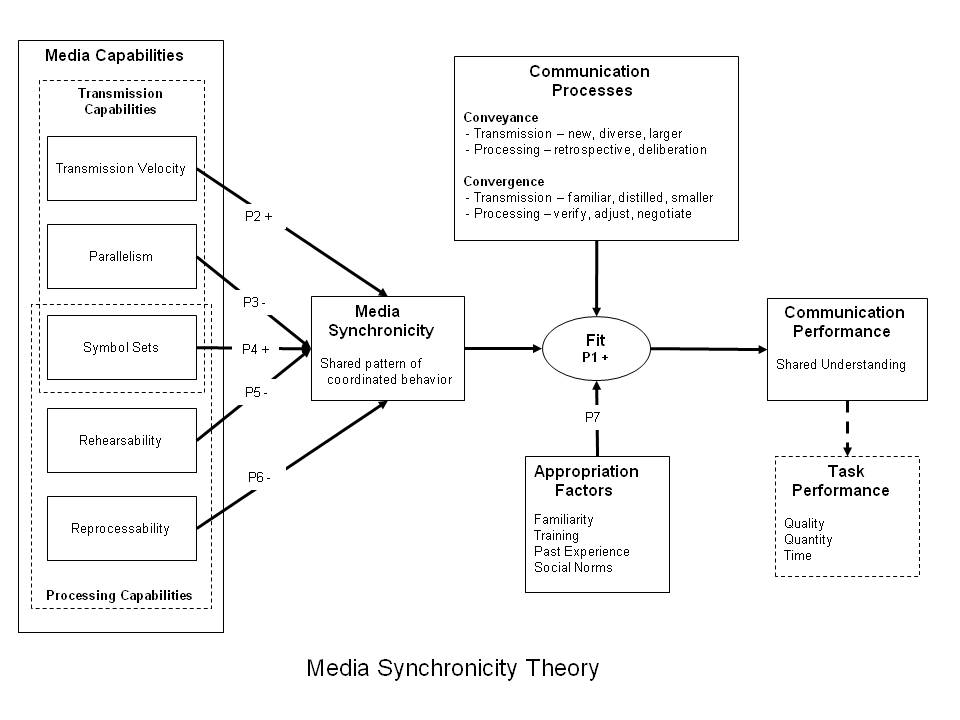 MST.jpg 960 × 720; 67 KB
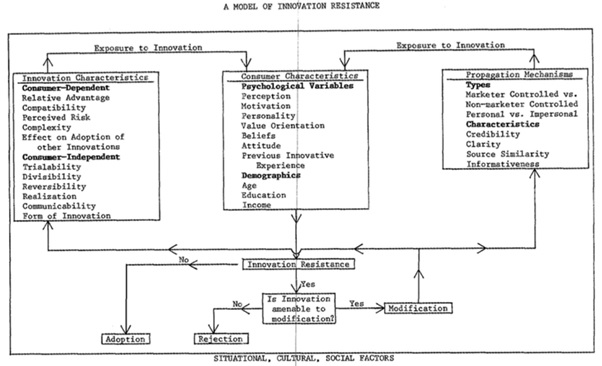 Model of IRT - Innovation Resistance Theory.jpg 602 × 366; 61 KB
 Mrt.JPG 577 × 360; 17 KB
 Norm Activation Theory.jpeg 689 × 367; 44 KB
 OCT.jpg 606 × 498; 37 KB
 OLT.jpg 541 × 211; 15 KB
 Okc1.JPG 213 × 146; 6 KB
 Okc2.JPG 213 × 146; 8 KB
 Okc3.JPG 444 × 156; 11 KB
 Organizational creativity diag.png 795 × 757; 105 KB
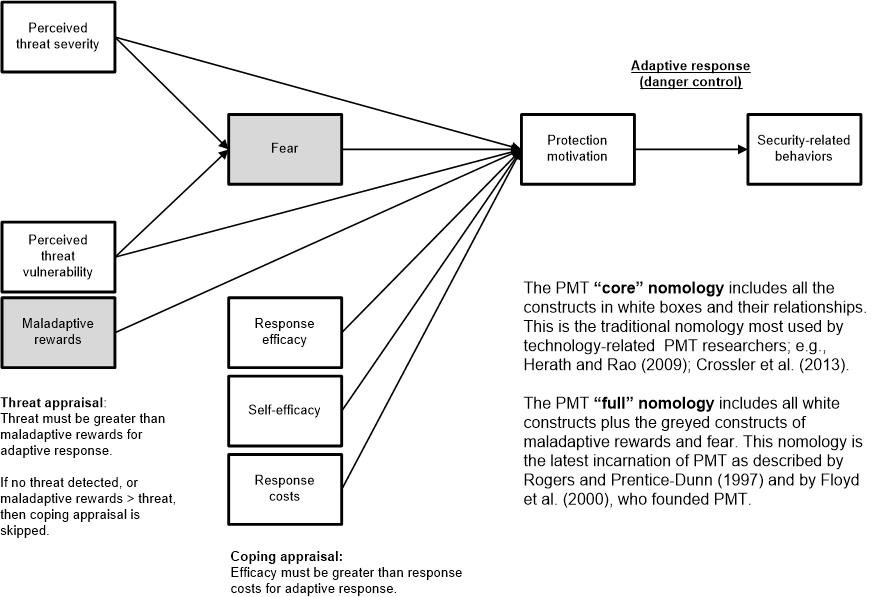 PMT figure 1.jpg 872 × 597; 78 KB
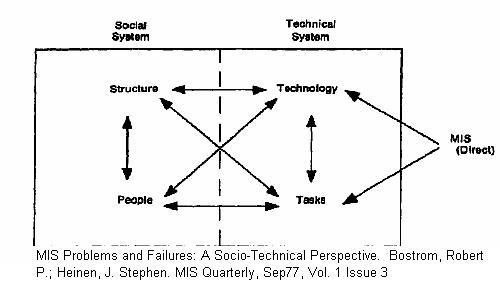
 POF.jpg 1,842 × 1,086; 70 KB
 PRT.jpg 591 × 415; 13 KB
 Pe1.JPG 220 × 193; 7 KB
 Pe2.JPG 229 × 186; 6 KB
 Picture.jpg 260 × 184; 9 KB
 Picture1.png 300 × 292; 47 KB
 PrinLogo.jpg 1,060 × 309; 89 KB
 Privacy Calculus Theory.png 680 × 427; 34 KB
 Psy framework.jpeg 1,842 × 1,086; 67 KB
 Psycho owner frame.jpg 930 × 535; 56 KB
 Psychological ownership framework.png 1,185 × 526; 80 KB
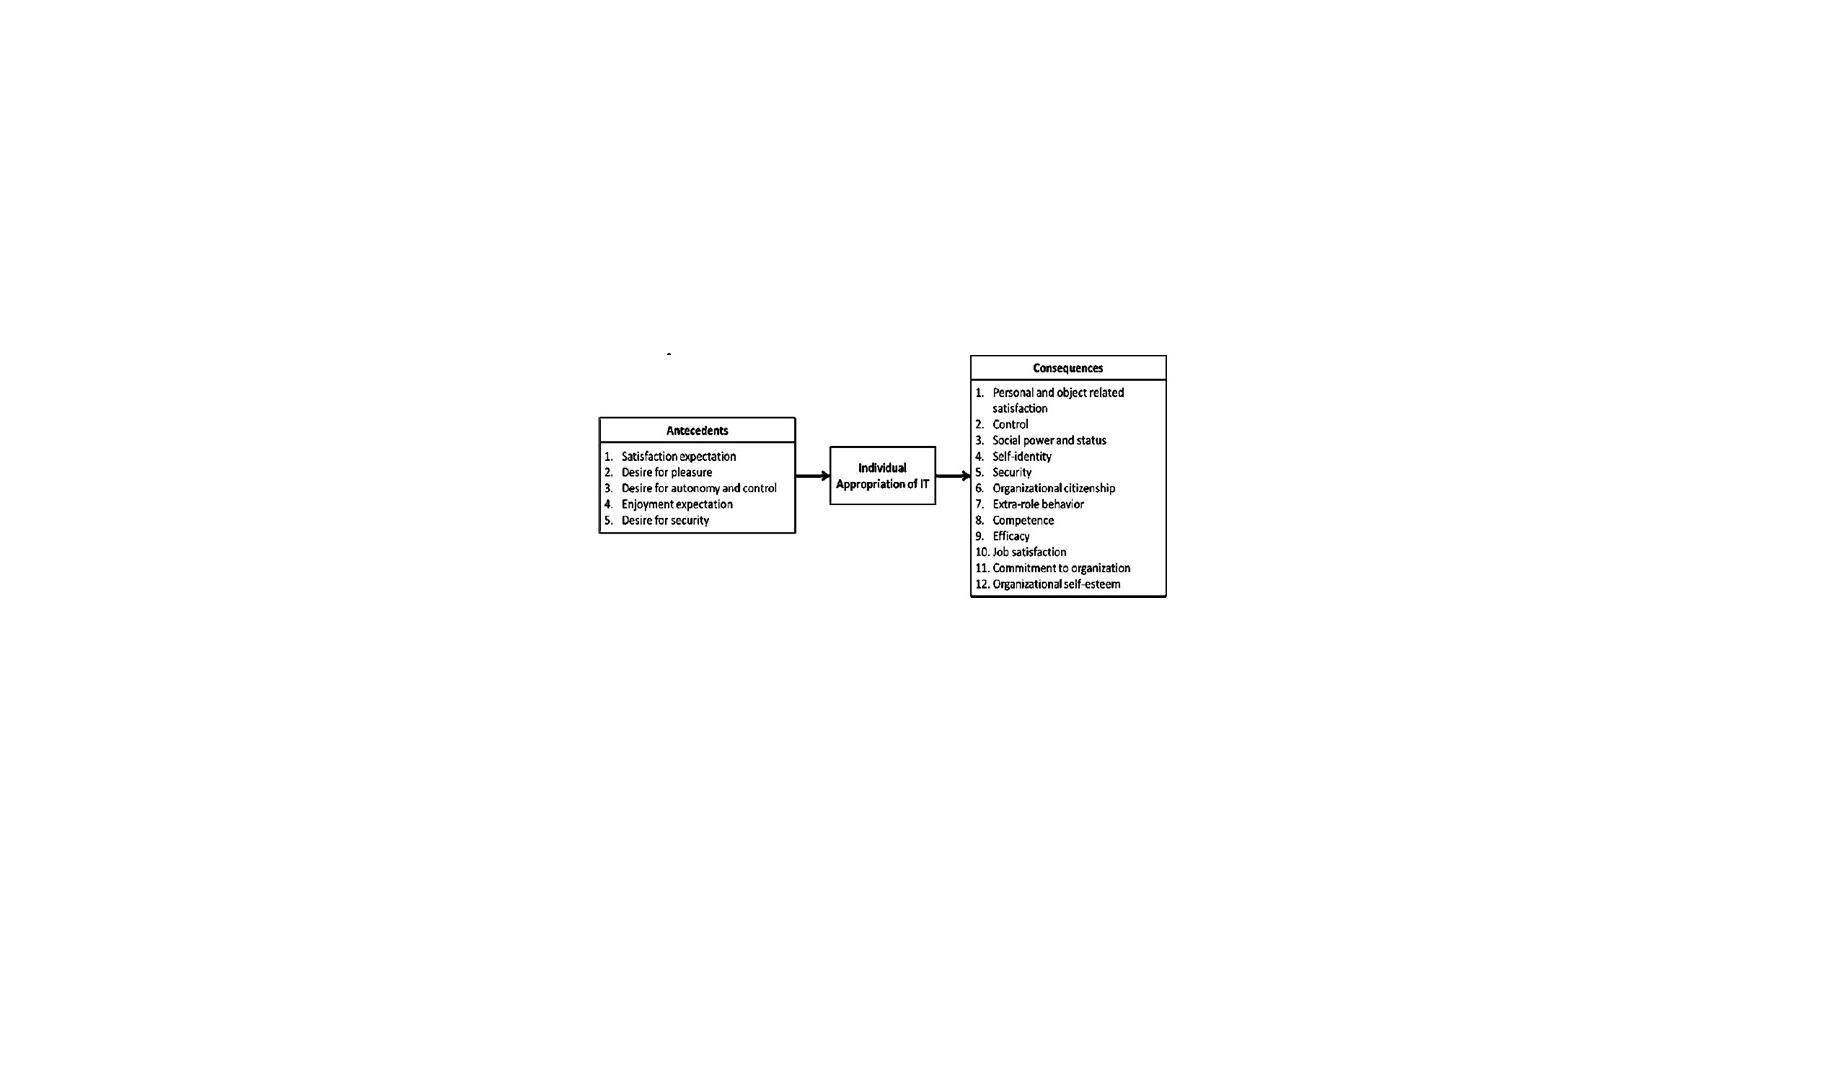
 Psychological ownership framework for the individual appropriation of technology.jpg 1,842 × 1,086; 85 KB
 Pvt schematic.JPG 635 × 200; 26 KB
 Rational Choice Theory.png 784 × 495; 31 KB
 Rbv.JPG 458 × 364; 33 KB
 Representation, State Tracking and Good-Decomposition Models.png 792 × 983; 84 KB
 Representation Theory.png 896 × 218; 14 KB
 Role Theory Diagram-1.png 648 × 452; 41 KB
 Rot1.JPG 297 × 367; 20 KB
 Rot2.JPG 760 × 491; 34 KB
 SBT.jpg 558 × 468; 33 KB
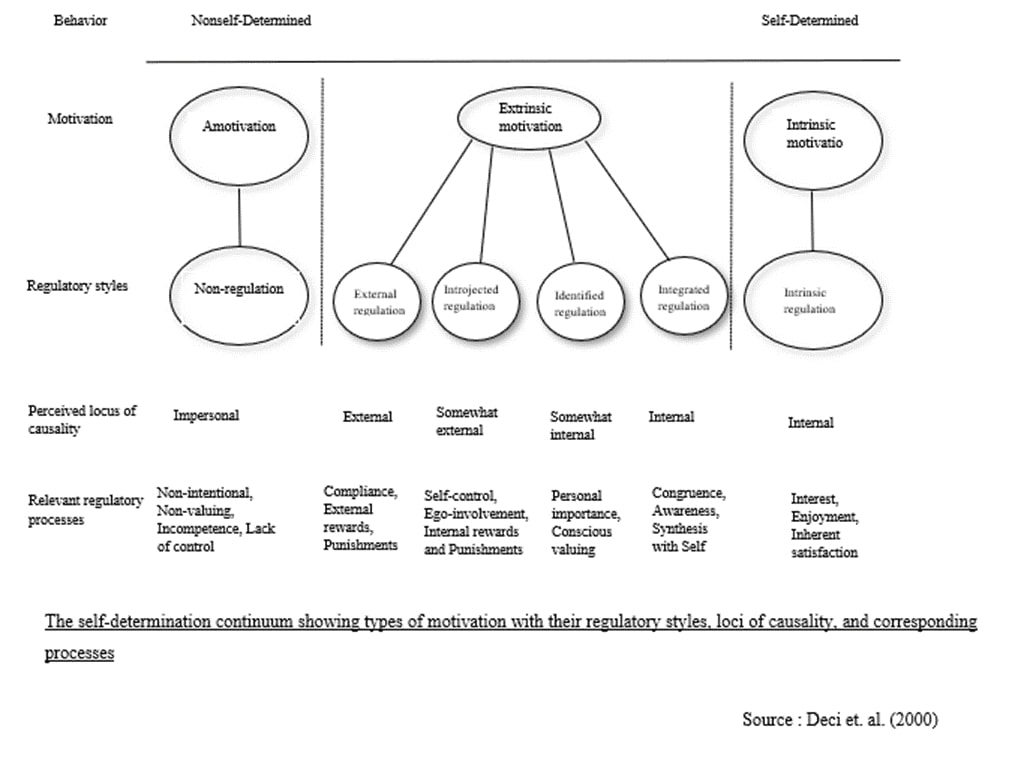 SDT.jpg 1,009 × 763; 63 KB
 SOIPSVM figure1.JPG 728 × 824; 61 KB
 SOIPSVM figure1.jpg 728 × 824; 61 KB
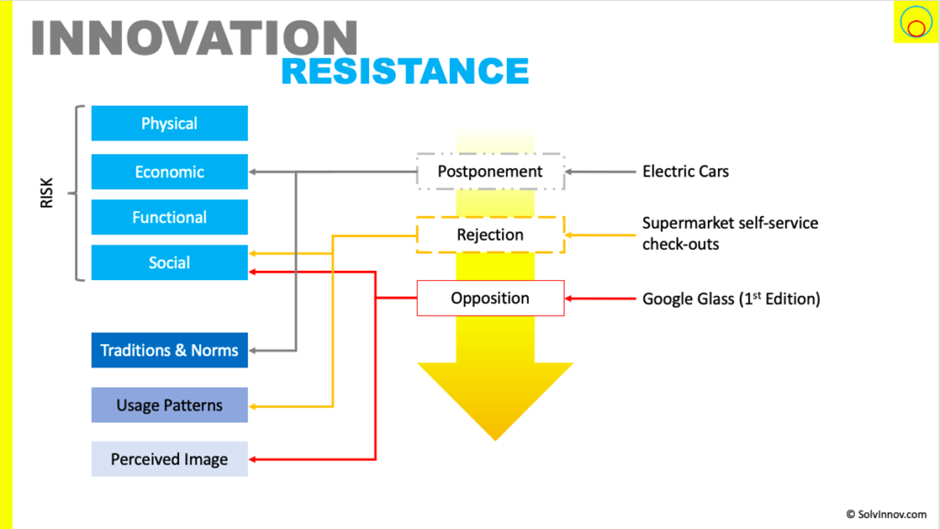 Schematic diagram of Innovation Resistance .png 940 × 529; 76 KB
 Scogt.JPG 378 × 239; 9 KB
 Sct.JPG 444 × 558; 26 KB
 Sht.JPG 693 × 467; 39 KB
 Snt.JPG 596 × 386; 40 KB
 Social media engagement theory.jpg 695 × 567; 70 KB
 Sociomaterialism Diagram.png 725 × 457; 20 KB
 Spmt.png 852 × 412; 70 KB
 Sst.JPG 676 × 667; 57 KB
 Stages of moral development by Kohlberg.jpg 488 × 731; 131 KB
 Sts.JPG 500 × 287; 22 KB
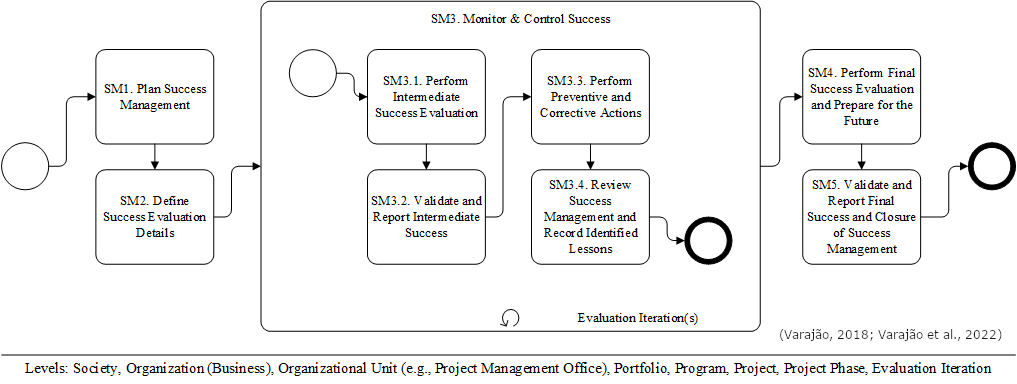 SuccessManagementRef.png 1,017 × 384; 48 KB
 Sxgt.jpg 440 × 319; 6 KB
 TFR Model.jpg 377 × 198; 19 KB
 TOE Model.JPG 659 × 336; 28 KB
 TRM-IS.png 481 × 606; 24 KB
 TSR.jpg 531 × 214; 23 KB
 TTD.jpg 929 × 811; 44 KB
 Tam.JPG 410 × 169; 10 KB
 Tce.JPG 631 × 204; 11 KB
 Tct.JPG 344 × 221; 16 KB
 Tda1.jpg 663 × 511; 44 KB
 Three Structures of an IS as per Representation Theory.png 672 × 377; 15 KB
 Tpb.JPG 549 × 234; 16 KB
 Tra.JPG 424 × 177; 8 KB
 Ttf.JPG 427 × 223; 12 KB
 Utuat.JPG 493 × 310; 27 KB
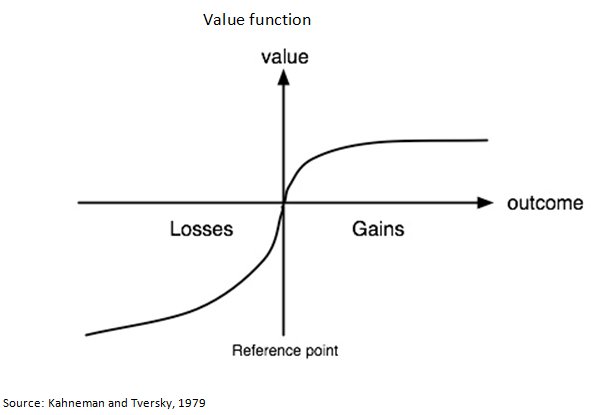
 Value Theory.png 758 × 661; 40 KB
 Value theory diagram.png 740 × 558; 40 KB
 Wst1.JPG 569 × 376; 28 KB
 Wst2.JPG 503 × 384; 31 KB


